
Frozen bilberry is a seasonal, wild-harvest ingredient where most commercial outcomes are “decided” upstream—during a short intake window, under constrained freezing/sorting capacity, and then either preserved or destroyed by cold-chain execution. This guide maps the real physical flow, shows where cost structurally accumulates, and translates those nodes into the spec and contracting levers procurement teams can actually use.
Insight: Frozen bilberry (Vaccinium myrtillus) is physically constructed around a short wild-harvest window feeding a capacity-constrained freezing system; most cost and quality outcomes are determined before the product ever reaches export cold storage.
Data: In key Nordic origins, bilberry picking commonly concentrates from late July through early September (later at higher latitudes), creating a compressed intake period where plants must clean, sort, and freeze quickly to protect quality and minimize foreign matter.
Procurement Impact: Your “true” supply chain is not farm → factory; it’s forest collectors → aggregation/buying stations → freezer intake → cleaning/sorting → IQF/block freeze → cold storage → reefer export. Fixed cost drivers concentrate at intake (labor + yield loss), sorting (technology + rejects), freezing/cold storage (energy + capacity), and cold-chain integrity (claims risk).

Insight: Bilberry cost is a stack of (1) raw fruit acquisition under yield uncertainty, (2) pack-out loss during cleaning/sorting, (3) energy-intensive freezing + long inventory holding, and (4) cold-chain logistics where temperature excursions can destroy value.
Data: Codex for quick-frozen bilberries ties completion of freezing to reaching −18°C at the thermal center, and industry cold-chain practice typically targets 0°F/−18°C or colder for frozen fruit quality preservation.
Procurement Impact: The “unit cost” you pay is heavily shaped by conversion yield (what gets rejected as stems/leaves/soft fruit), the freezing format (IQF vs block), and how much cold storage + reefer time sits inside your lead time.
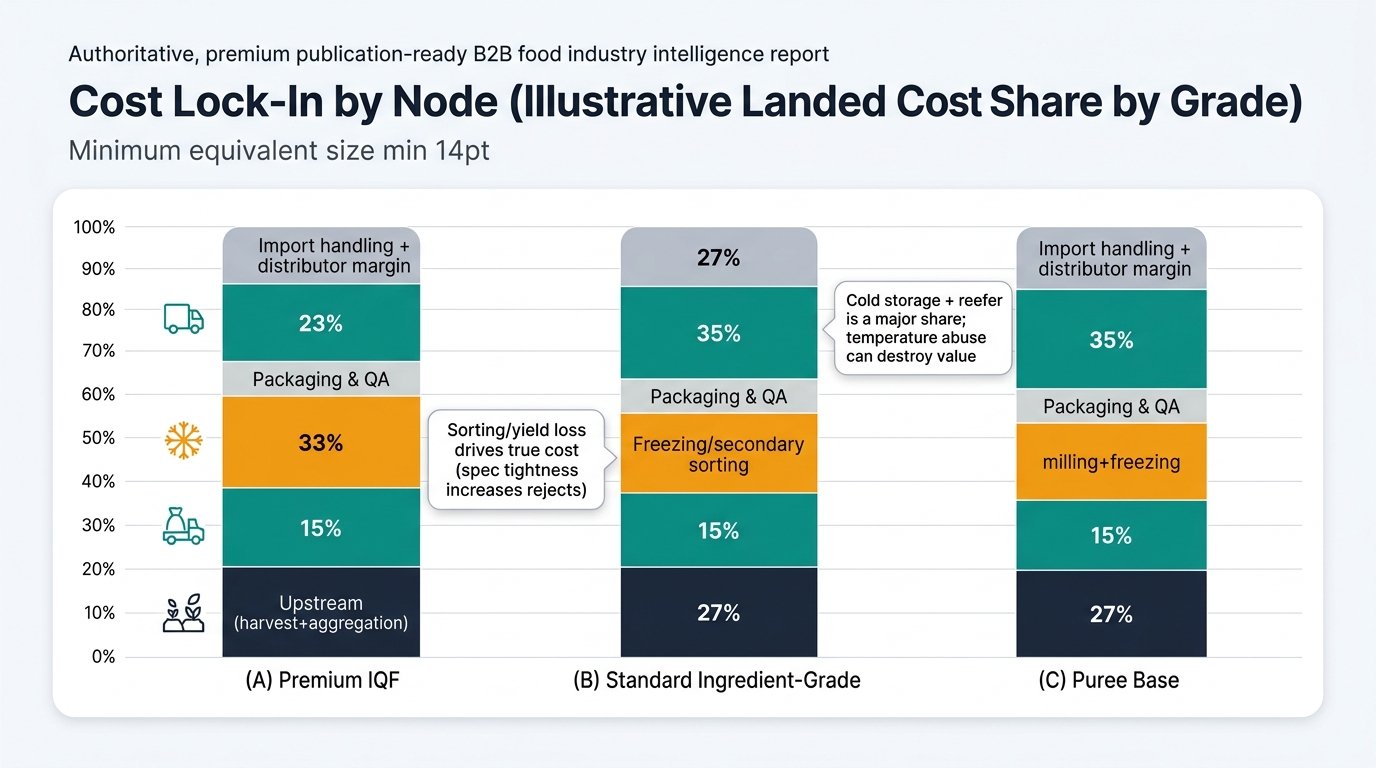
Note: Ratios vary by origin, grade stringency, packaging format, and route. These are structural “shape of cost” estimates to help you locate where cost accumulates, not a price forecast.
| Supply Chain Node | Cost Ratio (% of Final Landed Cost) | Notes |
|---|---|---|
| Upstream (harvest + aggregation) | 35% | Labor-driven; quality variability creates yield loss downstream. |
| Primary processing (clean/wash/de-stem) | 12% | Yield haircut + labor/water/wastewater (if washed). |
| Freezing + secondary sorting | 18% | Energy + capacity + optical sorting passes to meet tight spec. |
| Packaging & QA release | 8% | Higher QA intensity; stronger packaging to protect IQF integrity. |
| Cold storage + reefer logistics | 17% | Long frozen holding + reefer route + port dwell sensitivity. |
| Import handling + distributor margin | 10% | Customs, cold warehouse handling, channel margin. |
| Supply Chain Node | Cost Ratio (% of Final Landed Cost) | Notes |
|---|---|---|
| Upstream (harvest + aggregation) | 38% | Raw fruit dominates; still seasonal and labor-driven. |
| Primary processing | 10% | Fewer sorting passes; higher tolerance reduces reject loss. |
| Freezing (IQF or block) + basic sorting | 14% | More block freezing possible; less optical sorting intensity. |
| Packaging & QA release | 6% | Bulk packs; standard COA set. |
| Cold storage + reefer logistics | 20% | Logistics share rises when product value/grade is lower. |
| Import handling + distributor margin | 12% | Similar channel structure; margin/share often higher vs value. |
| Supply Chain Node | Cost Ratio (% of Final Landed Cost) | Notes |
|---|---|---|
| Upstream (harvest + aggregation) | 30% | Often uses lower-grade inputs; still seasonal procurement. |
| Primary processing | 8% | Cleaning before milling; foreign matter control still required. |
| Milling/pureeing + freezing | 22% | Additional processing step + energy; viscosity/seed management. |
| Packaging & QA release | 10% | Drums/aseptic liners (if used) + QA for consistency. |
| Cold storage + reefer logistics | 18% | Heavy, dense shipments; temperature integrity still critical. |
| Import handling + distributor margin | 12% | Channel and cold handling similar. |
Insight: Frozen bilberry behaves like a constrained wild-ingredient system, not a scalable orchard crop—so physical bottlenecks and documentation complexity are structural.
Data: Bilberry (Vaccinium myrtillus) is widely wild-collected across Northern Europe; ripening/fruiting is typically July to September, and commercial supply commonly moves through aggregation before industrial cleaning and freezing.
Procurement Impact: Three realities shape availability, quality, and claims risk regardless of supplier:
Insight: The supply chain’s “hard points” are aggregation discipline, sorting technology, freezing energy/capacity, and cold-chain continuity.
Data: Bilberry harvest in Nordic supply is typically concentrated in late summer (July–September), and quick-frozen standards/specs commonly anchor around −18°C as the critical temperature threshold.
Procurement Impact: When comparing offers, you are implicitly comparing (1) expected yield loss to hit your foreign matter/defect limits, (2) the plant’s ability to freeze and hold inventory without temperature excursions, and (3) how packaging + handling protect IQF integrity through ports and warehouses.
The Bottom Line for Your Next Contract:
(Analyzed at: Apr, 2026)
Write your next bilberry contract so it forces evidence on the two value-destroyers you can’t fix later: (1) foreign matter performance at pack-out (define EVM/defect limits and require lot-level inspection records) and (2) cold-chain integrity to −18°C (require calibrated recorder data through handoffs, not just a COA at ship). This works because bilberry economics are fundamentally yield-and-temperature economics: sorting determines how much usable fruit you actually buy, and logistics determines whether that value survives transit. With 2026 reefer capacity/rate volatility still elevated in many markets, teams that contract monitoring and contingency capacity up front typically avoid the quiet 2–6% landed-cost bleed that shows up later as clumping claims, rejections, rework, and emergency resupply—right when the seasonal window is already closed.


