INDUSTRY TRENDS

Frozen Apple Sourcing (IQF & Block): Validated Cost Drivers, Risk Signals, and Better Buying Decisions for Procurement Leaders

Author
Team Tridge
DATE
April 14, 2026
9 min read
frozen-apple Cover
Tridge Eye Data Intelligence Solution

This report is powered by Tridge Eye Data Intelligence.

Every data point, price signal, and supply risk insight in this analysis comes from the same platform that procurement and sourcing leaders worldwide rely on daily. As you read, consider what this level of market intelligence could do for your sourcing decisions.

Explore Tridge Eye →

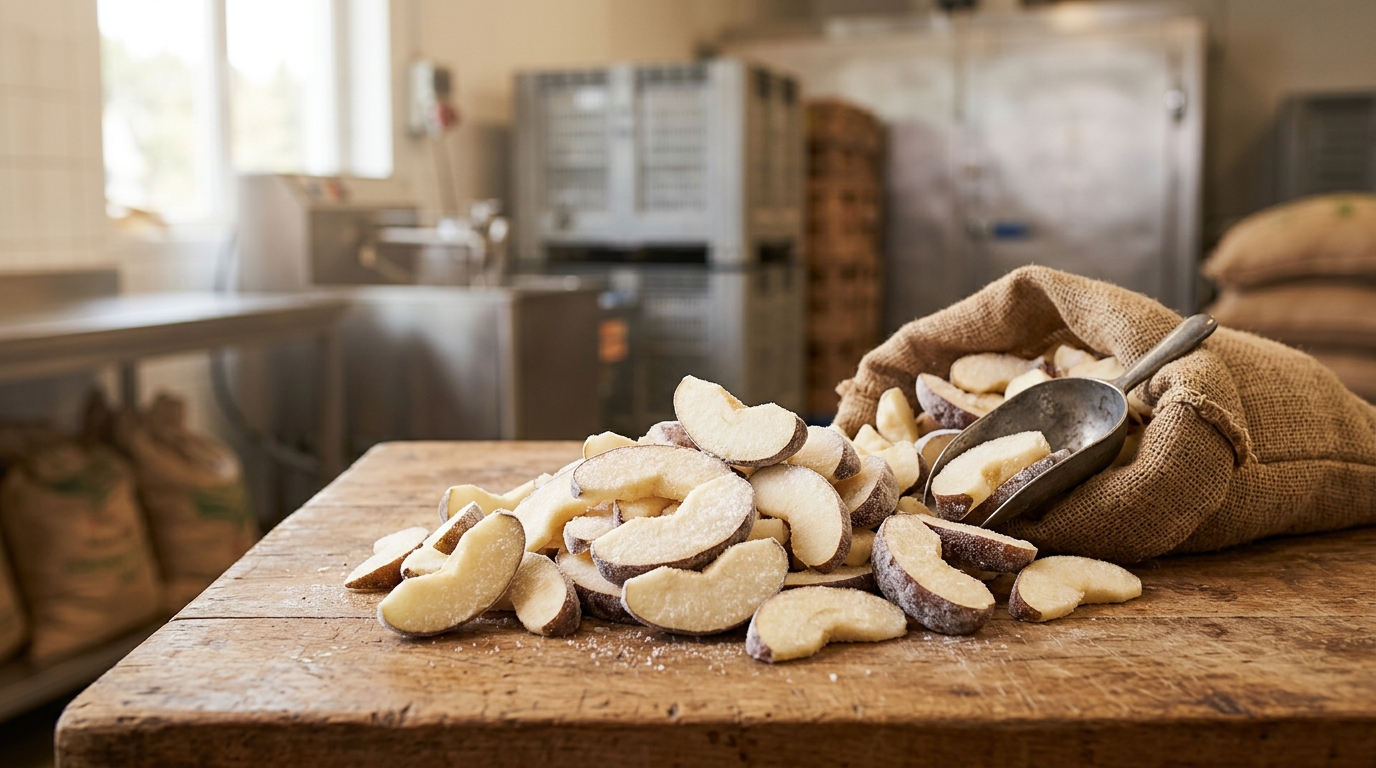
Frozen apples can look like a straightforward commodity until you see how many things must go right at once: the “right” processing-grade fruit at the “right” time, yield-sensitive cutting/peeling, energy-heavy freezing, and a cold chain that can quietly turn a good lot into a claim. This guide is written for procurement and sourcing managers who are experienced buyers—but newer to frozen apples—so it focuses on the decisions you must make (award, dual-source, contract structure, governance) and the category-specific signals that actually move cost, availability, and quality.

Executive Summary

  • Cold chain is part of the product spec: Many frozen programs target 0°F / −18°C or colder through storage and transport; excursions can show up as clumping, drip loss, and texture defects even if the COA looked fine at ship. [1]
  • “Crop headlines” are weak predictors of your delivered price: packout/allocation to fresh, conversion constraints (labor + IQF capacity), and energy/freight often dominate short-term pricing.
  • Poland matters structurally for EU processing supply: WAPA-referenced reporting shows Poland ~3.19 million MT (2024) and ~3.3 million MT forecast (2025)—a level that can still keep processing markets sensitive when stocks are tight. [2]
  • Should-cost is mostly yield + conversion + cold chain, not just “apples”: the biggest negotiation leverage usually comes from clarifying yield loss drivers (defects/trim), energy assumptions, and reefer/cold-storage terms—not from debating the orchard narrative.
  • Most avoidable disruptions are “time-to-switch” failures: if alternates aren’t pre-qualified (QA, trials, label/spec governance), you effectively single-source—whether you intended to or not.

Key Insights

(Analyzed at: Apr, 2026)

  • Strategy: Hold
  • Reliability: Medium
  • Potential Saving: 6% ~ 12%
  • Insight: If you are currently single-sourced (or single-origin) on IQF dices/slices, treat Q2–Q3 2026 as a “portfolio hardening” window rather than a pure price-chasing window: (1) pre-qualify at least one alternate processor/origin for your top 1–2 critical SKUs, and (2) renegotiate 2026–27 terms to separate raw fruit vs energy vs reefer/cold storage drivers (trigger-based reopeners or indexed components). The savings typically come from avoiding premium spot buys and reducing risk premiums (not from betting on one crop outcome). Poland/EU supply remains a swing factor, but the more actionable lever is converting that macro signal into dual-source readiness + clearer surcharge governance. [2]

1) What You’re Actually Buying: The Ground Truth of the Frozen-Apple Supply Chain

Frozen apples look like a simple commodity until you map what has to go right—from orchard outcomes to cut-size control to uninterrupted cold chain.

Typical supply chain flow (industrial IQF apples):

  1. Orchards / raw apples (processing-grade, culls/off-grade from fresh packout)
  2. Primary processing (wash/sort → peel/core → slice/dice; anti-browning/texture treatments)
  3. Freezing & finishing (IQF tunnel/spiral or block-freeze; de-clumping; final sorting)
  4. Packaging & QA release (bulk cartons with poly liners; metal detection/X-ray; COA)
  5. Cold storage & distribution (origin cold stores → reefer ocean or frozen truck → destination cold store)
  6. Customer use (bakery fillings, yogurt inclusions, smoothies, desserts; sometimes further cooking)
A left-to-right (or top-to-bottom) process flow showing the end-to-end frozen-apple supply chain with 6 labeled stages: (1) Orchards / raw apples (processing-grade, culls/off-grade), (2) Primary processing (wash/sort → peel/core → slice/dice; anti-browning/texture treatments), (3) Freezing & finishing (IQF tunnel/spiral OR block-freeze; de-clumping; final sorting), (4) Packaging & QA release (bulk cartons + poly liners; metal detection/X-ray; COA), (5) Cold storage & distribution (origin cold store → reefer ocean/frozen truck → destination cold store), (6) Customer use (bakery fillings, yogurt inclusions, smoothies, desserts; sometimes further cooking). Add small callouts (icons + 2–4 words each) for key procurement sensitivities at relevant nodes: 'Yield loss' at primary processing, 'Energy load' at IQF, 'Foreign material controls' at QA, 'Temperature integrity' at logistics. Avoid any dashboard/UI styling; keep it as a clean industrial infographic.

Category realities that matter to procurement leaders (even if you’re new to frozen apples):

  • Fresh-market packout drives your raw material price and availability. In “good fresh years,” more fruit may go to the fresh channel, tightening processor access; in “ugly fresh years,” processors may access more fruit—but defect load/quality variability can rise.
  • IQF is not just a pack style; it’s a cost structure. Energy, throughput efficiency, sanitation/downtime, and piece integrity become major cost and claim drivers.
  • Cold chain is part of the product spec. A shipment can pass factory QA and still arrive clumped, leaky, or texture-damaged if temperature control fails. Many frozen programs target 0°F (−18°C) or below through storage and transport. [1]

2) Where the Money Really Goes (and Why Price Moves Don’t Always Follow “Apple Crop News”)

2.1 Upstream: Orchards / Raw Apples (Processing Grade)

Key insight: Your biggest structural exposure is not “apples” broadly; it’s processing-eligible apples at the right time, competing with fresh-market demand.

What accumulates cost here

  • Crop size + packout rate: When retail-quality packout is high (and fresh prices are attractive), fewer apples flow to processing.
  • Weather volatility: Spring frost and bloom damage can reduce usable supply and shift defect load.
  • Variety and functional fit: Texture retention and browning behavior matter more than many buyers expect (especially for slices and bakery applications).

Procurement implication

  • A supplier quoting “stable price” may be buffering with inventory, hedged inputs, or margin—not ignoring raw risk.

2.2 Primary Processing: Wash/Sort → Peel/Core → Cut + Treatments

Key insight: This is where yield loss (trim, defects, bruising) quietly drives should-cost.

What accumulates cost here

  • Labor intensity: Peeling/coring/cutting are labor-heavy and yield-sensitive.
  • Yield variability: Defects increase trim loss; tighter cut-size specs can increase giveaway/rework.
  • Additives/process aids: Anti-browning and texture-setting treatments (e.g., ascorbic/citric, calcium salts) are usually smaller line items but high leverage for performance.

Procurement implication

  • Tightening defect tolerances or cut-size distribution can move cost more than buyers expect—because it changes rework and yield.

2.3 Secondary Processing: IQF Freezing (or Block) + Final Sorting

Key insight: IQF cost is dominated by energy + throughput + downtime, not just raw apples.

What accumulates cost here

  • Freezing energy load: IQF tunnels/spirals and refrigeration systems are heavy energy consumers.
  • Line efficiency: Downtime, icing, and cleaning cycles reduce output and raise unit cost.
  • Piece integrity: Breakage and clumping risk drive downgrade/rework.

Procurement implication

  • When energy costs spike, IQF pricing can move faster than raw apple pricing—especially on spot volumes.

2.4 Packaging & QA Release

Key insight: “Same apple, different carton” is not trivial—pack format affects damage rate, warehouse handling, and claims.

What accumulates cost here

  • Packaging materials: Poly liners, cartons, pallets, labeling.
  • Food safety controls: Metal detection/X-ray and documented preventive controls for physical hazards are common expectations in modern programs.

Procurement implication

  • A cheaper offer with weaker foreign material controls can create downstream costs (holds, rework, complaints) that dwarf the unit price delta.

2.5 Cold Storage & Logistics (Origin → Destination)

Key insight: Cold chain is where “paper savings” often die—temperature excursions convert into clumping, drip loss, texture breakdown, and claims.

What accumulates cost here

  • Cold storage fees: Storage and handling at origin and destination.
  • Reefer ocean / frozen trucking: Freight volatility and equipment availability.
  • Insurance + demurrage risk: Delays can raise cost and quality exposure.

Procurement implication

  • Lowest CFR/CIF price is not lowest landed cost if it increases probability of claims or line disruption.

2.6 End-Market Margins (Importer/Distributor/Co-packer/Retail)

Key insight: Margin stacks are shaped by inventory carry (working capital) and service level (ability to deliver in-spec, on-time, in-season).

What accumulates cost here

  • Inventory holding cost (frozen inventory ties up cash for months)
  • Distributor service margin (smaller MOQs, faster replenishment, credit terms)

Product-level cost breakdown (illustrative)

Modeled % of final delivered cost to a North American industrial buyer. Actuals vary by origin, season, pack format, contract terms, and freight.

A data-driven 100% stacked bar chart with three bars labeled: 'IQF Dices (bulk cartons)', 'IQF Slices (bulk cartons)', and 'Block-frozen pieces (commodity)'. Each bar is segmented into the same 6 cost buckets with a consistent color legend: Raw apples; Primary processing; Freezing (IQF or block); Packaging & QA release; Cold storage + freight (landed); Importer/distributor margin & finance. Use the article’s illustrative ratios: IQF Dices = 35/18/17/7/13/10; IQF Slices = 33/20/17/7/13/10; Block = 38/16/10/6/15/15. Add a small annotation near the chart title: 'Illustrative model — varies by origin/spec/terms'. Keep styling clean and procurement-friendly; no product UI elements.

A) IQF Apple Dices (bulk cartons)

Supply Chain Node Cost Ratio (% of Final Delivered Cost) What drives variance
Raw apples (processing-grade) 35% Crop size/packout, variety mix
Primary processing (peel/core/cut/treat) 18% Labor, yield loss, defect load
IQF freezing & final sorting 17% Energy, throughput, downtime
Packaging & QA release 7% Pack format, inspection intensity
Cold storage + freight (landed) 13% Reefer rates, cold store handling
Importer/distributor margin & finance 10% Inventory carry, service level

B) IQF Apple Slices (bulk cartons)

Supply Chain Node Cost Ratio (% of Final Delivered Cost) What drives variance
Raw apples 33% Variety suitability for slices
Primary processing 20% Slice integrity, yield loss
IQF freezing & final sorting 17% Clumping risk, energy
Packaging & QA release 7% Bag/liner specs
Cold storage + freight 13% Lane volatility
Importer/distributor margin & finance 10% Inventory carry

C) Block-frozen Apple Pieces (lower-spec / commodity)

Supply Chain Node Cost Ratio (% of Final Delivered Cost) What drives variance
Raw apples 38% Fruit availability
Primary processing 16% Less stringent sorting
Freezing (block) 10% Lower energy/handling than IQF
Packaging & QA release 6% Simpler pack
Cold storage + freight 15% Same cold chain exposure
Importer/distributor margin & finance 15% Higher buffer margin for quality variability

3) Structural Facts You Can Build a Sourcing Strategy Around

  1. Poland is a structural swing factor for Europe. WAPA-referenced reporting shows Poland at ~3.19 million MT (2024) and ~3.3 million MT forecast (2025)—levels that can keep processing markets sensitive even when general headlines suggest “recovery.” [2]
  2. Processing demand is coupled across products. Apples can be pulled into juice/concentrate, puree, or frozen pieces depending on relative economics—so your frozen-apple availability can be affected by what’s happening in adjacent processing markets.
  3. Cold chain failures are non-linear. A small temperature abuse can create a large quality defect (clumping/texture), turning a “cheap” shipment into a production interruption—hence why many programs hold 0°F / −18°C or colder as a practical standard. [1]

4) The Critical Insight: Why Frozen-Apple Prices Disconnect from “Apple Crop” Headlines

Procurement teams often expect: Big crop → cheap frozen apples and small crop → expensive frozen apples.

In reality, frozen-apple pricing frequently disconnects because:

  • Packout and allocation matter more than total crop. A moderate crop with strong fresh-market pricing can starve processors.
  • Conversion constraints dominate during peak season. If peeling/cutting labor or IQF capacity is constrained, raw apples don’t automatically translate into frozen output.
  • Energy and logistics can overwhelm raw moves. IQF is energy-intensive; reefer availability and congestion can change landed cost faster than orchard fundamentals.
  • Inventory buffers delay pass-through. Frozen inventory smooths short-term shocks—until it doesn’t, at which point spot markets gap up.

What to watch instead of generic crop headlines

  • Processing-grade availability signals (packout commentary, defect load)
  • IQF line utilization / labor tightness during peak months
  • Reefer and cold storage capacity constraints
  • Claims/quality chatter (clumping, drip loss, foreign material incidents)

5) Where Procurement Teams Commonly Misstep (Especially When New to Frozen Apples)

  1. Treating IQF apples as interchangeable across suppliers
  2. Small differences in variety mix, anti-browning approach, and cut tolerance can change finished product performance.
  3. Over-indexing on unit price and under-weighting “time-to-switch”
  4. Switching requires QA validation, sometimes plant trials, and label/spec governance—often weeks to months.
  5. Writing contracts that ignore the true cost stack
  6. Fixed price without defined triggers (energy/freight) can backfire as surcharges, service failures, or silent spec drift.
  7. Assuming cold chain is the logistics team’s problem
  8. Temperature excursions show up as procurement problems: claims, disputes, and emergency buys.
  9. Single-sourcing critical SKUs because “we’ve never had an issue”
  10. Frozen apples fail quietly until a disruption hits; then alternates are unqualified.

6) What an Intelligence-Driven Approach Changes (Decision-by-Decision, Not Feature-by-Feature)

This is how procurement teams use intelligence outputs to make better frozen-apple decisions across cost, continuity, quality, and governance—without pretending intelligence replaces audits or lab testing.

Decision A: “Do we dual-source this SKU, and where?”

Intelligence that changes the outcome

  • Supplier landscape shortlisting by pack style (dices/slices), certifications, and capacity indicators
  • Concentration mapping by origin/processor/lane
  • Time-to-switch estimates (qualification steps + typical lead times)

Trade-off made explicit

  • Dual-source increases qualification and sometimes inventory cost, but reduces catastrophic stockout risk.

Decision B: “What should we pay, and what’s our negotiation anchor?”

Intelligence that changes the outcome

  • Should-cost decomposition: raw apples vs yield loss vs labor vs energy vs packaging vs cold-chain freight
  • Benchmarks across comparable lanes and specs to detect outliers

Trade-off made explicit

  • The cheapest quote may embed higher claim risk or weaker service levels.

Decision C: “What do we lock in the contract, and what do we leave flexible?”

Intelligence that changes the outcome

  • Identify which drivers are structurally volatile (energy, reefer freight, crop/packout)
  • Set pricing mechanisms aligned to those drivers (indexing or trigger-based reopeners)

Trade-off made explicit

  • More flexible pricing reduces supplier risk premium but requires stronger governance.

Decision D: “How do we govern suppliers so issues surface early?”

Intelligence that changes the outcome

  • Scorecard design: OTIF proxies, claim/defect trend signals, spec conformance drift, and concentration exposure
  • Market-signal monitoring to trigger reviews before failures (weather anomalies, logistics constraints)

What this does NOT replace

  • On-site audits, customer-specific approvals, and lab verification.

7) Strategic Use Cases Procurement Leadership Can Run in 2–6 Weeks

  1. SKU criticality segmentation + portfolio redesign
  2. Classify SKUs by line-stoppage risk and substitution feasibility.
  3. For “A” SKUs (high criticality), design dual/tri-source and minimum safety stock logic.
  4. Should-cost negotiation pack for IQF dices/slices
  5. Build a cost-driver narrative and define what evidence you’ll accept for surcharges.
  6. Ready-bench alternate supplier program
  7. Pre-screen alternates by certifications, pack formats, and capacity; define a fast-track qualification pathway.
  8. Cold-chain risk controls embedded in buying terms
  9. Clarify temperature recording expectations, claims windows, and responsibilities at handoffs.
  10. Quarterly governance cadence with decision logs
  11. Tie market movements to actions taken (contracting, inventory, supplier shifts) and outcomes.

8) Why This Matters Beyond Frozen Apples (Examples Your Team Likely Buys Too)

The same intelligence-driven sourcing logic applies to other categories where upstream variability, conversion constraints, and logistics integrity drive outcomes:

  • Frozen berries: IQF capacity, labor, and cold-chain integrity often matter as much as farm output.
  • Tomato paste / puree: Raw crop size matters, but processing capacity, energy, and packaging availability can dominate delivered cost.
  • Orange juice concentrate: Weather and disease drive supply, but inventory timing and contract structure determine budget outcomes.
  • Shrimp (frozen): Yield, processing compliance, and cold-chain handling can overwhelm nominal farmgate price differences.

Across these categories, teams win by:

  • Separating structural vs temporary drivers
  • Designing contracts around the true cost stack
  • Maintaining qualified alternates before disruption hits

9) Why Frozen Apples Are a High-Signal Example for Procurement Teams

Frozen apples compress many procurement challenges into one category:

  • Cost: Raw fruit + yield + energy + freight all matter—and move differently.
  • Continuity: Switching is real work (QA validation, trials, lead times).
  • Quality: Spec drift and cold-chain failures show up as operational pain, not just QC metrics.
  • Governance: The category rewards teams that document assumptions, monitor triggers, and manage supplier performance systematically.

When procurement treats frozen apples as “just another frozen fruit,” they tend to optimize unit price and discover the real costs later—via claims, shortages, and emergency substitutions.

Tridge Eye Data Intelligence Solution

Make Faster, Data-Driven Sourcing Decisions

The insights in this report are just the starting point. Tridge Eye is the data intelligence solution that gives procurement and sourcing leaders real-time market signals, price benchmarks, and supply risk alerts — so you can act before the market moves.

Explore Tridge Eye →

References

  1. fsis.usda.gov
  2. apps.fas.usda.gov
Subscribe
By subscribing you agree to with our Privacy Policy and provide consent to receive updates from our company.
Thank you! Your submission has been received!
Oops! Something went wrong while submitting the form.
Subscribe to receive the latest blog posts, updates, promotions, and announcements from Tridge.