Frozen açaí is best sourced as a conversion-and-cold-chain category, not a simple “fruit buy.” If you map where yield, microbiological risk, freezing capacity, and cold-chain custody are set, you can predict where landed cost will stick (and where negotiations won’t move the needle). This guide translates the physical chain into procurement levers you can use in awards, contracts, and supplier portfolio design.
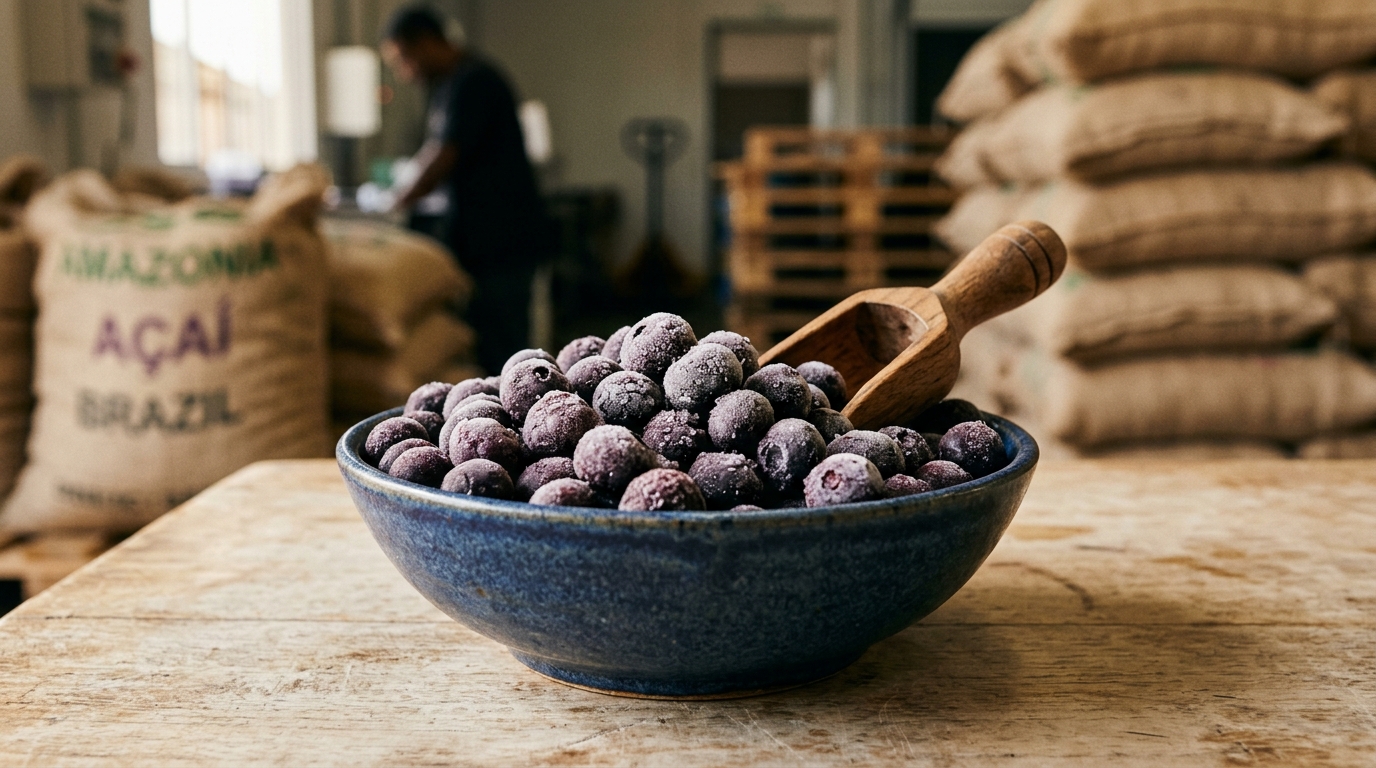
Frozen açaí is not a typical fruit ingredient supply chain—it is a cold-chain-dependent conversion business built around a highly perishable Amazon fruit that must be pulped quickly after harvest to avoid fermentation and quality loss. The physical map is structurally stable: upstream collection is dispersed and manual; processing is concentrated near origin; export relies on reefer infrastructure; and downstream users often depend on co-packers and frozen storage.
Insight: Cost and risk are structurally “locked in” early—once fruit is harvested and routed, the chain’s yield, microbiological outcomes, and cold-chain integrity largely determine what downstream buyers can accept.
Data: Açaí is highly seed-heavy (commonly cited around ~80% seed by weight; edible fraction often ~5–15% depending on maturity/origin), so yield is structurally constrained; small shifts in ripeness and handling time change sellable pulp output and spec consistency.
Procurement Impact: The biggest fixed cost drivers are not just “fruit price,” but conversion yield, freezing capacity, and temperature control across long transit times.
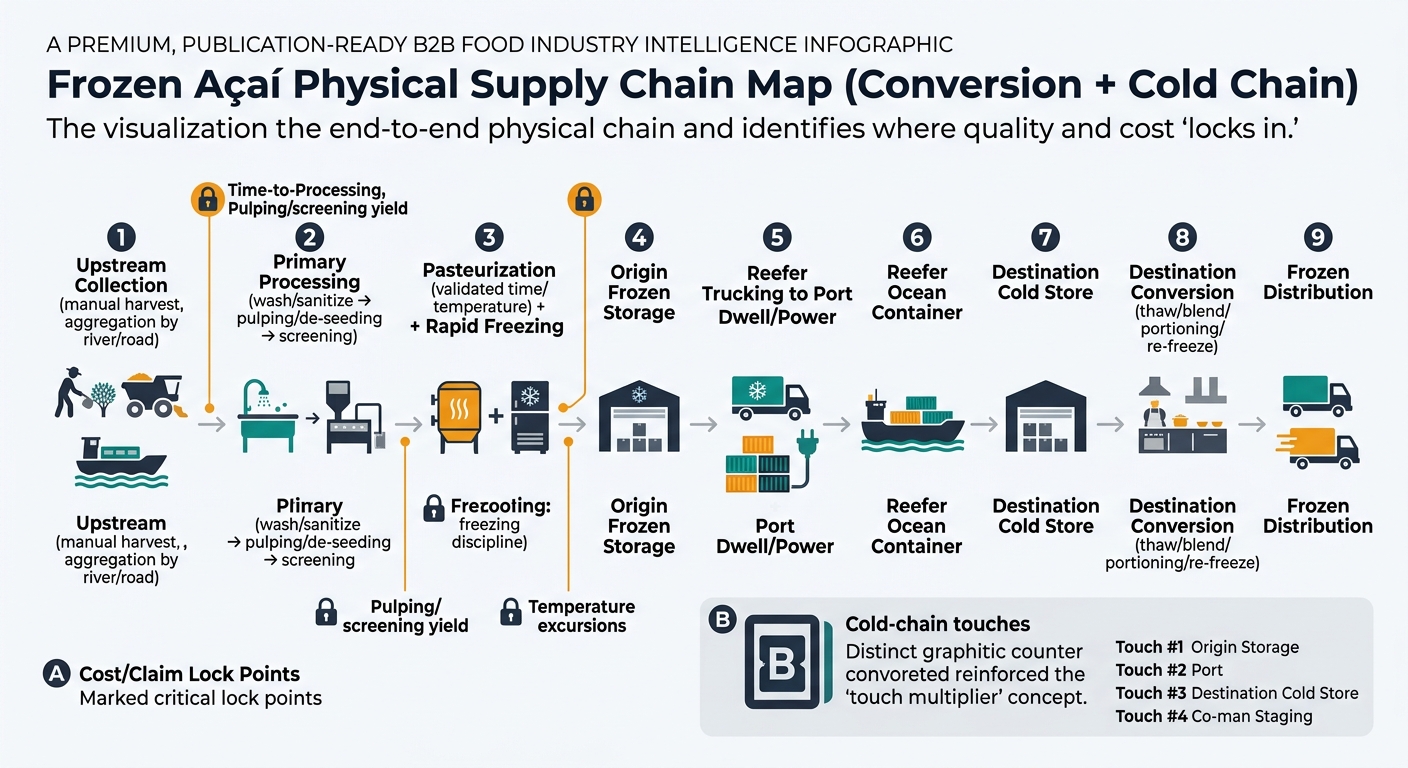
Insight: Frozen açaí behaves like a “conversion + cold-chain” product: each node adds cost through yield loss, energy, packaging, QA, and temperature-controlled logistics.
Data: The chain typically carries multiple frozen storage touches (origin storage, in-transit, destination cold store, and sometimes co-man staging), each adding energy, handling, and shrink exposure.
Procurement Impact: When evaluating suppliers or formats, you’re effectively choosing a cost structure (yield + energy + packaging + logistics), not just a unit price.
| Supply Chain Node | Cost Ratio (% of Final Cost) | Notes |
|---|---|---|
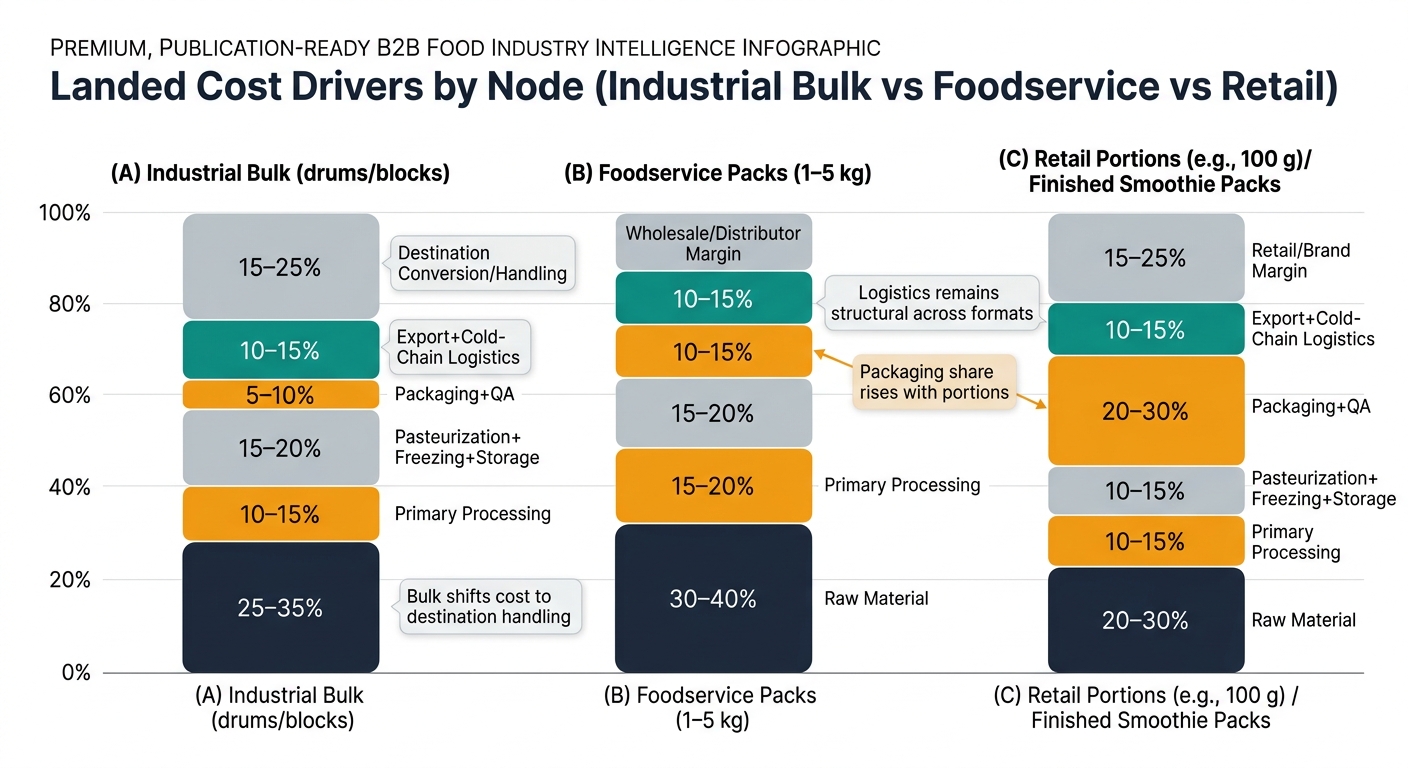
| Raw Material Cost (harvest + aggregation) | 25–35% | Manual labor + first-mile logistics; effective yield depends on time-to-processing. |
| Primary Processing (pulping/screening) | 12–18% | Yield loss from pits/insolubles; sanitation water + labor + equipment throughput. |
| Pasteurization + Freezing + Origin Frozen Storage | 10–16% | Energy-intensive; capacity constraints can drive allocation and format limits. |
| Packaging & QA Release | 5–10% | Liners/seals, labeling/traceability, micro testing, foreign matter controls. |
| Export + Destination Cold-Chain Logistics | 18–28% | Reefer freight + port dwell + destination cold storage + handling touches. |
| Destination Conversion/Handling (if applicable) | 5–12% | Thaw/pump/re-freeze losses and labor if buyer converts bulk into portions/blends. |
| Supply Chain Node | Cost Ratio (% of Final Cost) | Notes |
|---|---|---|
| Raw Material Cost | 20–30% | Same upstream physics; higher downstream value density shifts ratios. |
| Primary Processing | 10–16% | Spec consistency becomes more visible to end users. |
| Pasteurization + Freezing + Origin Frozen Storage | 10–15% | Similar energy profile; more packaging line time required. |
| Packaging & QA Release | 10–18% | Higher film/carton cost, portioning labor, more labels/traceability units. |
| Export + Destination Cold-Chain Logistics | 15–25% | More cases/handling; cube utilization matters. |
| Wholesale/Distributor Margin (cold-chain) | 8–15% | Frozen distribution margin reflects storage and route economics. |
| Supply Chain Node | Cost Ratio (% of Final Cost) | Notes |
|---|---|---|
| Raw Material Cost | 12–22% | Raw fruit becomes a smaller share versus packaging and retail margin. |
| Primary Processing | 8–14% | Tight spec control needed for repeatable consumer experience. |
| Pasteurization + Freezing + Origin/Destination Frozen Storage | 10–16% | Often multiple storage touches; shelf-life protection depends on temperature discipline. |
| Packaging & QA Release | 18–30% | Highest packaging intensity: portioning, seals, cartons, coding, more QC points. |
| Export + Cold-Chain Logistics | 12–20% | Case handling and last-mile frozen are structurally expensive. |
| Retail/Brand Margin | 15–30% | Category economics shift heavily to branding, merchandising, and shrink control. |
Insight: Frozen açaí’s biggest “constants” are biological yield limits, origin infrastructure dependencies, and cold-chain physics—not market sentiment.
Data: The fruit’s pit-heavy anatomy constrains conversion yield; the supply base is geographically concentrated in the Amazon basin (with Pará as the dominant producing state in Brazil); and frozen distribution requires continuous temperature control across multiple handoffs.
Procurement Impact: These realities shape availability, format options, and quality variance even in stable pricing environments.
(Analyzed at: Apr, 2026)
Write your next açaí contract so the supplier is commercially accountable for the two things that actually drive downstream claims: (1) a defined “time-to-processing” control (documented harvest-to-pulp window and traceability) and (2) cold-chain custody evidence (reefer temperature records and agreed excursion rules). This works because yield and microbiological risk are set before freezing, and temperature abuse during dwell/hand-offs is where “good pulp becomes a claim.” If you don’t hard-code these controls, you’ll pay later—typically in the form of avoidable rejects, emergency rework, and expedited replacement freight that can easily add mid-single-digit percent to delivered cost in a disruption month.


