INDUSTRY TRENDS

Dried Shrimp & Prawn Sourcing (U.S. Buyer Guide): Linking Spec, Process Control, and Import Risk to Better Awards

Author
Team Tridge
DATE
April 1, 2026
10 min read
dried-common-shrimp-and-prawn Cover
Tridge Eye Data Intelligence Solution

This report is powered by Tridge Eye Data Intelligence.

Every data point, price signal, and supply risk insight in this analysis comes from the same platform that procurement and sourcing leaders worldwide rely on daily. As you read, consider what this level of market intelligence could do for your sourcing decisions.

Explore Tridge Eye →

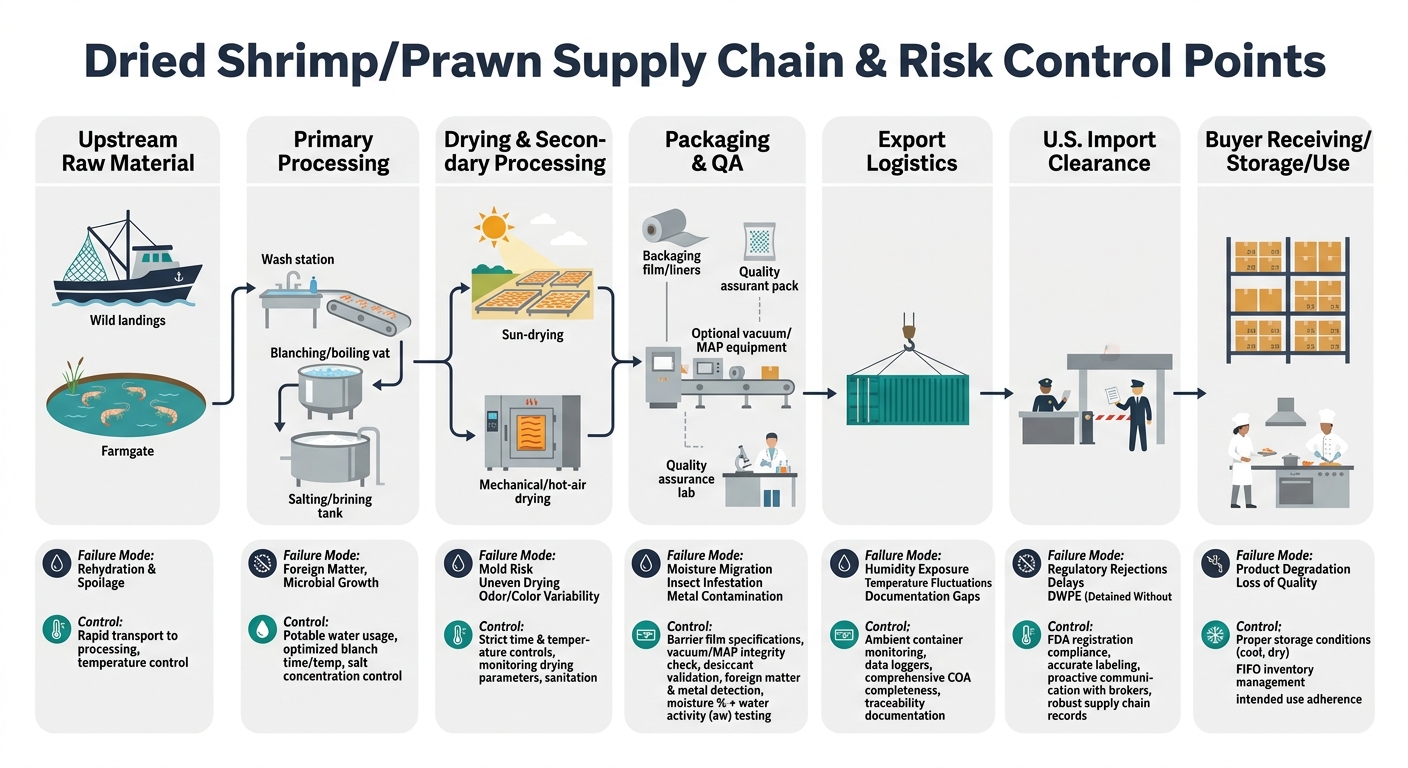
Dried shrimp/prawn can look like a simple, shelf-stable ingredient, but procurement outcomes (cost, continuity, and claims exposure) are usually driven by a few fundamentals: upstream raw-material variability, the supplier’s ability to control moisture/water activity and contamination risk during drying, and U.S. import compliance discipline (especially for aquaculture-origin shrimp/prawns where drug-residue enforcement can create sudden holds and cost). This guide translates those realities into practical award, contracting, and governance actions for procurement & sourcing management teams.

Executive Summary

  • Not a pure commodity: Dried shrimp/prawn is a spec-defined risk bundle (species/grade + moisture/water activity + additive policy + hygiene controls + packaging + documentation). Treating it as “just dried seafood” is a common root cause of paid-price variance and quality claims.
  • Drying method is a governance lever:Sun drying tends to be more weather-dependent and higher exposure to contamination vectors; hot-air/mechanical drying is generally more controllable and auditable (at higher energy cost).
  • Water activity matters (not only moisture %): FDA guidance commonly uses aw ≤ 0.85 as a key threshold associated with shelf-stability regulatory treatment (context-dependent), making aw a practical procurement spec element—not just a QA detail.
  • Disease shocks can be extreme: Industry literature documents that shrimp diseases (e.g., AHPND/EMS; WSSV) can drive very high mortalities (up to 100% in affected populations/hosts under certain conditions)—which can quickly change size mix and availability.
  • Import enforcement can create real premiums: FDA Import Alerts can enable detention without physical examination (DWPE), and FDA has specifically cited nitrofuran/chloramphenicol residues in shrimp/prawns as a basis for DWPE actions (example: Peninsular Malaysia notice).
  • Cost tables are illustrative, not “truth”: The modeled node percentages are directionally reasonable for procurement discussions, but should be used as benchmarking scaffolding and validated against your own landed-cost and claims data.

Key Insights

(Analyzed at: Apr, 2026)

  • Strategy: Hold
  • Reliability: Medium
  • Potential Saving: 3% ~ 8%
  • Insight: In April 2026, the best near-term value is typically not “chasing the lowest FOB,” but tightening the spec-to-process fit and using competitive tension to reduce hidden landed-cost leakage. Run a 30–45 day re-bid/benchmark focused on (1) aw/moisture capability + packaging humidity protection, and (2) documentation discipline that reduces DWPE/hold risk. Where you already have stable compliance performance, treat price moves as a negotiation around risk premium, not just raw shrimp cost—then reallocate volume to the supplier(s) with the best total cost-to-serve (OTIF + claims + hold probability), not the lowest quote.

1) What You’re Actually Buying: The Ground Truth of the Dried Shrimp/Prawn Supply Chain

Dried shrimp/prawn looks like a “simple, shelf-stable ingredient,” but procurement outcomes are driven by upstream biology + processing yield + moisture/water activity control + import compliance.

The real flow (and where things go wrong)

  1. Upstream raw material
  2. Inputs are typically small wild-caught shrimp (often mixed species) and/or small/off-grade farmed shrimp (commonly vannamei in global aquaculture).
  3. Availability and size mix move with fishing seasons, aquaculture harvest cycles, and disease events.
  4. Primary processing near landing/farm zones
  5. Rapid handling, washing, grading, blanch/boil, salting/brining.
  6. Early handling quality determines whether drying “locks in” a clean product—or locks in problems.
  7. Drying & secondary processing
  8. Sun-drying: lower capex, higher variability (weather/humidity, contamination exposure).
  9. Mechanical drying (hot air/tunnel/other controlled systems): higher energy cost, generally better consistency and auditability; can reduce drying time and improve control versus sun drying in many settings.
  10. Optional steps: peeling/shelling, milling (powder/flakes), seasoning.
  11. Packaging & QA
  12. Moisture/water activity control, foreign matter removal, metal detection where applicable.
  13. Packaging quality (barrier film, vacuum/MAP where used, liners, desiccants) is a major determinant of shelf life and claims.
  14. Export logistics & import clearance
  15. Usually ambient freight, but humidity exposure (containers, ports, warehouses) can rehydrate product.
  16. Import holds/detentions and documentation gaps can convert “cheap” supply into high demurrage + stockout risk.
  17. Buyer receiving, storage, and use
  18. Your internal storage conditions (humidity, pest control, odor migration) can create “supplier” problems that are actually downstream handling problems.

Procurement implication: dried shrimp/prawn is not a single commodity. It is a spec-defined risk bundle (species/grade + moisture/aw + additive policy + hygiene controls + packaging + documentation) that must be governed like a high-risk ingredient.

A supply-chain flow diagram for dried shrimp/prawn showing stages from upstream raw material through processing, drying (sun vs mechanical), packaging & QA, export logistics, U.S. import clearance, and buyer receiving/storage, with risk-control callouts for issues like rehydration, mold risk, foreign matter, odor/color variability, and documentation gaps and corresponding controls such as aw/moisture specs, packaging barriers, COA completeness, and traceability.

2) Where the Money Really Accumulates: Cost & Margin by Supply-Chain Node

Below is a procurement-oriented view of cost build-up. Percentages are illustrative modeling ranges; actuals vary by origin, grade, yield, labor intensity (esp. peeling), and packaging format.

2.1 Upstream Raw Shrimp/Prawn (Wild landings or farmgate)

Key insight: The raw shrimp price and size distribution dominate the economics of dried shrimp/prawn. When disease or seasonal shifts change what sizes are available, your dried spec can become structurally “harder to make,” not just “more expensive.”

  • Major cost drivers
  • Farmgate/landing price
  • Size mix (small shrimp suitable for drying vs. competing demand)
  • Fuel (wild capture), feed/seed (farmed)
  • Local labor availability
  • Margin reality
  • Fragmented upstream supply often means price discovery is noisy and broker-driven.

2.2 Primary Processing (grading, blanching/boiling, salting)

Key insight: This node determines the baseline hygiene and uniformity. If upstream handling is weak, drying does not “fix” it.

  • Major cost drivers
  • Labor for sorting/grading
  • Energy for boiling/blanching
  • Salt/brine inputs
  • Rework and reject rates
  • Procurement watch-outs
  • Inconsistent blanching and sanitation show up later as odor/color variability and higher micro counts.

2.3 Drying & Secondary Processing (sun vs. mechanical; peeling; milling)

Key insight: Drying is a yield and risk conversion step: you’re paying for water removal, but you’re also buying the supplier’s ability to hit stable moisture and water activity without contamination.

  • Major cost drivers
  • Yield loss (water removal + breakage)
  • Energy (mechanical drying)
  • Weather risk (sun-drying)
  • Sorting for foreign matter
  • Why mechanical drying often wins for governance
  • More controllable process; often improves consistency and reduces exposure to outdoor contamination vectors versus sun drying.

2.4 Packaging & Quality Assurance

Key insight: Packaging is not “just a bag.” For dried shrimp/prawn, packaging is a humidity-control system.

  • Major cost drivers
  • Barrier materials, vacuum/MAP (where applied), liners
  • Desiccants/container liners
  • QA testing (moisture/aw, micro, foreign matter)
  • Labeling and traceability documentation

2.5 Logistics, Duties, and Inventory Carry

Key insight: Because product is shelf-stable, many buyers underestimate inventory carrying cost + quality drift risk (rehydration, oxidation, infestation) across long ambient lanes.

  • Major cost drivers
  • Inland freight from coastal plants
  • Ocean freight + port dwell time
  • Demurrage/inspection delays
  • Working capital tied up in inventory

2.6 Importer/Distributor Margin (and your internal cost-to-serve)

Key insight: The “cheapest FOB” supplier can be the most expensive landed option once you price claims, delays, and rework.

  • Major cost drivers
  • Importer margin (risk premium)
  • Your receiving QA and reinspection cost
  • Scrap/hold cost from nonconforming lots

Product-level cost breakdown (illustrative)

Modeled as % of final delivered cost to a U.S. buyer; ranges reflect typical variance by origin, packaging, and quality regime.

A) Bulk dried shrimp (shell-on), industrial/foodservice cartons

Supply chain node Cost ratio (% of final delivered cost) Notes
Upstream raw shrimp/prawn 45–60% Dominated by landing/farmgate price and size mix
Primary processing 8–12% Sorting + blanching/salting labor/energy
Drying & secondary processing 10–18% Yield loss + energy or weather risk
Packaging & QA 4–8% Liners/cartons + basic testing
Logistics & duties + inventory carry 10–16% Port dwell time and working capital matter
Importer/distributor margin 6–12% Risk premium varies with compliance history

B) Peeled/shelled dried shrimp (higher labor content)

Supply chain node Cost ratio (% of final delivered cost) Notes
Upstream raw shrimp/prawn 35–50% Higher conversion cost reduces raw share
Primary processing 10–15% More grading and prep labor
Drying & secondary processing 15–25% Peeling/shelling yield + labor is material
Packaging & QA 5–10% Often tighter foreign matter and micro specs
Logistics & duties + inventory carry 10–16% Similar lanes; higher value increases finance cost
Importer/distributor margin 6–12% Premium for consistent compliance

C) Dried shrimp powder/flakes (milled)

Supply chain node Cost ratio (% of final delivered cost) Notes
Upstream raw shrimp/prawn 30–45% Can use fines/off-cuts, but quality risk can rise
Primary processing 8–12% Baseline hygiene still crucial
Drying & secondary processing 20–30% Milling, sieving, foreign matter control
Packaging & QA 6–12% Higher oxidation/odor control needs
Logistics & duties + inventory carry 10–16% Powder is sensitive to moisture pickup
Importer/distributor margin 6–12% Higher due to spec sensitivity
Three side-by-side stacked bar charts (small multiples) showing illustrative delivered cost build-up by supply-chain node for A) bulk shell-on, B) peeled/shelled, and C) powder/flakes, with range bands for each segment: upstream raw shrimp/prawn, primary processing, drying & secondary processing, packaging & QA, logistics & duties plus inventory carry, and importer/distributor margin; includes a legend and a note that ranges are modeled as percent of final delivered cost to a U.S. buyer.

3) One Structural Fact That Explains Most Surprises

Dried shrimp/prawn supply is a “sink” for variability upstream: it absorbs small sizes, off-grades, and seasonal gluts, but it is also the first product to get squeezed when upstream supply tightens or size distributions shift.

What causes the squeeze:

  • Aquaculture disease shocks can create rapid mortality and reduce harvest volume (and change size profiles). Literature on shrimp diseases reports very high mortalities (up to 100%) in affected systems/hosts under certain conditions.
  • Weather/humidity directly disrupts sun-drying feasibility and increases mold risk.
  • Competing demand for small shrimp (fresh/frozen, local markets) can pull raw material away.

Procurement implication: you should treat dried shrimp/prawn as seasonal + disruption-sensitive, even though it ships ambient and stores well.

4) The Critical Insight: Why “Market Price” and Your Paid Price Disconnect

In this category, paid-price variance is rarely just negotiation skill. It’s usually a mismatch between:

  1. Your spec (what you require)
  2. moisture/water activity stability
  3. size/count/grade and breakage limits
  4. additive policy (e.g., sulfites) and labeling constraints
  5. foreign matter tolerances
  6. The supplier’s process capability (what they can repeatedly hit)
  7. sun vs. mechanical drying control
  8. sorting intensity and metal detection
  9. documentation discipline and traceability depth
  10. The lane risk (what happens between plant and your dock)
  11. port dwell times and humidity exposure
  12. inspection probability and import holds

A practical way to diagnose the disconnect

  • If your price spikes but market chatter says “flat,” ask:
  • Did your spec tighten (explicitly or implicitly through customer complaints)?
  • Did your supplier shift to better packaging/QA after a claim?
  • Did compliance risk rise (import scrutiny, residues concern), increasing the supplier’s risk premium?

Compliance-driven price premiums are real

FDA import enforcement can include Import Alerts that allow detention without physical examination (DWPE) for future shipments when violations are identified. FDA has also issued shrimp/prawn-specific communications referencing nitrofuran/chloramphenicol residues and DWPE actions (e.g., Peninsular Malaysia update).

5) The Most Common Procurement Mistakes (and Why They Repeat)

  1. Treating dried shrimp/prawn like a simple dried commodity
  2. Awarding primarily on unit price without pricing moisture/aw control, packaging, and claims risk.
  3. Spec ambiguity that forces suppliers to “interpret” quality
  4. Missing or weak definitions for moisture/aw, salt %, size grading method, foreign matter limits, acceptable odor/color ranges.
  5. Single-origin dependency disguised as multi-supplier
  6. Two “different” suppliers sourcing from the same coastal cluster or using the same upstream consolidators.
  7. Late qualification of alternates
  8. Alternates exist “on paper,” but documentation, samples, and trial runs are not completed until disruption hits.
  9. No governance cadence
  10. Quality incidents are handled as one-offs; the same failure mode recurs because corrective actions are not tracked to closure.

6) What Procurement Intelligence Changes (Signal vs. Proof)

This is where an intelligence-driven approach improves decision quality without pretending to replace QA.

The key shift: from “quote comparison” to “decision-grade evidence”

Procurement intelligence supports four buyer decisions:

  1. Award / re-award (who gets volume)
  2. Contract structure (spot vs. term; index logic; validity windows)
  3. Risk controls (which lots need tighter testing; which lanes need buffer)
  4. Governance (how you manage suppliers month-to-month)

How intelligence maps to dried shrimp/prawn realities

  • Supplier discovery & longlisting
  • Build a longlist by origin, product form (shell-on, peeled, powder), and process type (sun vs. mechanical).
  • Outcome: reduces over-reliance on incumbents before disruption.
  • Benchmarking & peer comparison
  • Compare suppliers on proxies like shipment regularity, documentation completeness patterns, complaint frequency, and lead-time reliability.
  • Outcome: award decisions that reflect total cost-to-serve, not just FOB.
  • Price intelligence & market signals
  • Separate raw shrimp drivers (seasonality, disease) from packaging/QA cost drivers.
  • Outcome: negotiation bands and timing discipline; fewer panic buys.
  • Risk monitoring
  • Track disruption signals (disease reports, extreme weather, port congestion) and map exposure by origin/spec.
  • Outcome: earlier triggers for safety stock, alternate activation, and contract flexibility.
  • Performance & governance analytics
  • Scorecards: OTIF, claim rate, COA completeness, moisture/aw nonconformance, corrective action closure time.
  • Outcome: fewer repeat failures and better audit readiness.

Boundaries (what still needs “proof”)

Intelligence can prioritize where to investigate; it does not replace:

  • on-site audits
  • lab testing (micro, residues, moisture/aw)
  • traceability verification and legal compliance review

7) Strategic Use Cases Procurement Leaders Can Run Immediately

Use case A: Build a “two-speed” alternate bench (fast-qualify vs. develop)

  • Segment alternates into:
  1. Document-ready: can ship under your additive policy, has consistent packaging, provides traceability docs
  2. Audit-needed: promising cost but needs capability development

Decision threshold: Maintain at least one document-ready alternate per critical spec (shell-on bulk, peeled, powder).

Use case B: Contracting that matches volatility drivers

  • When raw shrimp volatility is the driver:
  • Use layered buys or quarterly resets rather than long fixed-price commitments.
  • When compliance/QA upgrades are the driver:
  • Lock in process and packaging specs and pay a stable premium to reduce claims.

Use case C: Spec rationalization to unlock resilience

  • If you have multiple SKUs with near-identical use:
  • Harmonize moisture/aw and size tolerances where feasible.

Trade-off: Slightly wider spec may reduce unit price and increase supplier options, but must be validated by QA and product teams.

Use case D: Lane-risk buffers and receiving controls

  • For high-risk lanes/seasons:
  • Add humidity protection requirements (liners/desiccants)
  • Increase receiving inspection intensity

Decision threshold: If port dwell time or inspection delays rise, increase buffer stock before peak humidity periods.

8) Why This Intelligence Approach Transfers to Other Categories You Also Buy

The pattern here—spec-defined risk + upstream shocks + compliance exposure—is not unique to dried shrimp.

Examples procurement teams commonly manage in parallel:

  • Spices (e.g., chili, paprika, pepper)
  • Similar dynamics: contamination risk, adulteration risk, humidity sensitivity, and high cost of holds/recalls.
  • Nuts (e.g., peanuts, almonds)
  • Aflatoxin risk + origin concentration + strong QA gating; cheapest unit price often loses to best governance.
  • Dried fruits (e.g., raisins, cranberries)
  • Moisture control, sulfite/additive policy, and packaging drive shelf life and claims.
  • Coffee/cocoa
  • Weather-driven volatility, origin concentration, and certification/traceability claims that require strong governance.

Transferable lesson: procurement intelligence is most valuable when quality and compliance risks create hidden costs that are not visible in a quote sheet.

9) Why Dried Shrimp/Prawn Is a High-Impact Proof Point for Procurement Intelligence

This category is a strong demonstration case because it combines:

  • High variability upstream (seasonality and disease-driven supply shifts)
  • Process-dependent consistency (drying method and hygiene discipline)
  • Material import compliance exposure (DWPE mechanisms and residue-related enforcement actions)
  • A large gap between unit price and total cost-to-serve (claims, holds, rework, downtime)

What “good” looks like (procurement management view)

  • A portfolio with:
  • a primary supplier optimized for consistency and compliance
  • a secondary supplier qualified for continuity
  • a development track supplier for cost-down (with a gated plan)
  • A governance rhythm:
  • monthly scorecard review
  • quarterly spec/market reset
  • pre-defined escalation rules for nonconformance

Concrete next steps a procurement manager can run this week

  1. Freeze the spec in procurement language (one page): species/type, size/count method, moisture target and/or aw target, salt %, additive policy, foreign matter limits, packaging, shelf life, required docs.
  2. Map exposure: which SKUs depend on a single origin, a single drying method, or a single exporter.
  3. Create an alternate bench: at least 5–10 candidates segmented into document-ready vs. audit-needed.
  4. Stand up a scorecard for current suppliers: OTIF, claims, COA completeness, moisture/aw nonconformance rate, corrective action closure time.
  5. Set negotiation bands using price signals + your own paid-price history; decide in advance when you buy spot vs. layer vs. reset quarterly.
Tridge Eye Data Intelligence Solution

Make Faster, Data-Driven Sourcing Decisions

The insights in this report are just the starting point. Tridge Eye is the data intelligence solution that gives procurement and sourcing leaders real-time market signals, price benchmarks, and supply risk alerts — so you can act before the market moves.

Explore Tridge Eye →

Subscribe
By subscribing you agree to with our Privacy Policy and provide consent to receive updates from our company.
Thank you! Your submission has been received!
Oops! Something went wrong while submitting the form.
Subscribe to receive the latest blog posts, updates, promotions, and announcements from Tridge.