INDUSTRY TRENDS

Dried Bean Sourcing: Where Cost, Quality, and Risk Actually Sit (and How to Buy Smarter)

Author
Team Tridge
DATE
April 1, 2026
9 min read
dried-common-bean Cover
Tridge Eye Data Intelligence Solution

This report is powered by Tridge Eye Data Intelligence.

Every data point, price signal, and supply risk insight in this analysis comes from the same platform that procurement and sourcing leaders worldwide rely on daily. As you read, consider what this level of market intelligence could do for your sourcing decisions.

Explore Tridge Eye →

Dried common beans look like a straightforward commodity purchase, but most cost overruns and service failures are decided before your PO is cut—by crop-year grade, how much “field-run” turns into your spec after cleaning/sorting (spec yield), and inland logistics basis. This guide translates those realities into procurement decisions you can govern (coverage, supplier strategy, spec tiering) and measure (OTIF, claims, price variance vs benchmark).

Executive Summary

  • Hidden lever: In beans, markets often clear on exportable/retail-grade availability, not total harvested volume—so “big crop” can still mean firm FOB if grade is scarce.
  • Spec yield = margin + risk: Supplier economics are heavily driven by sorting shrink/yield loss required to hit your defect limits; this explains why same-origin quotes can diverge.
  • USDA/FGIS specs confirm tight defect economics: USDA commodity specs commonly require U.S. No. 1 grade (with defined moisture/defect limits) for program deliveries, reinforcing how quality thresholds constrain supply. [1]
  • Storability is not “risk-free”: Adverse storage temperature/humidity can contribute to hard-to-cook (HTC) and quality deterioration, increasing functional and claims risk. [2]
  • Modeled cost concentration (directionally correct): Raw material + logistics usually dominate delivered cost; packaging dominates only in retail-ready formats. Use the tables as negotiation focus, not as universal truth.
  • 90-day actions that pay: Build a standing alternate bench by bean class, implement a bean-specific scorecard, and run a QA/Ops spec-tiering workshop to widen optionality without increasing escapes.

Key Insights

(Analyzed at: Apr, 2026)

  • Strategy: Hold
  • Reliability: Medium
  • Potential Saving: 4% ~ 10%
  • Insight: For most North American buyers, April is typically a decision window for coverage posture rather than an automatic “buy now” signal: lock only the portion of volume where your risk is highest (single-origin exposure, tight specs, long lead-time lanes), and keep the remainder flexible until you validate (1) crop-year grade signals, (2) inland basis/freight direction, and (3) supplier “spec yield” assumptions via COA trends and recent lot performance. The saving comes less from guessing price direction and more from avoiding over-coverage at a premium while still preventing emergency buys and OTIF penalties.

1) What you’re actually buying: the ground truth of the dried common bean flow

Dried common beans (Phaseolus vulgaris—pinto, black, navy, kidney, etc.) look like a simple commodity, but procurement outcomes are usually decided upstream of your PO—at harvest quality, cleaning/sorting yield, and inland logistics.

The real supply chain (practical view):

  1. Farm/field-run beans (variable moisture, splits, foreign material, insect risk)
  2. Primary processing (cleaning, destoning, sizing, optical sorting, blending into spec)
  3. Secondary processing (optional) (splits, flour, quick-cook, ingredient-grade for canning)
  4. Packaging & QA (bulk sacks/FIBCs, retail packs, COAs, lot control)
  5. Logistics (inland to port/rail; containers; moisture protection; demurrage)
  6. End market (retail, foodservice, industrial/canners)

Why this matters for Procurement & Sourcing Management:

  • Beans are storable, so supply shocks don’t always show up as “no offers”—they show up as spec slippage, wider price spreads, longer lead times, and higher claim rates.
  • The biggest hidden cost is often yield loss during sorting (what gets removed to hit your defect limits) plus OTIF risk from inland/port constraints.
Flowchart showing the dried bean supply chain from field-run beans through primary processing, optional secondary processing, packaging & QA, logistics, and end markets, with callouts for where risk enters and decision flags for crop-year grade, spec yield, and inland logistics basis.

2) Where margin is made (and lost): cost & value build by node

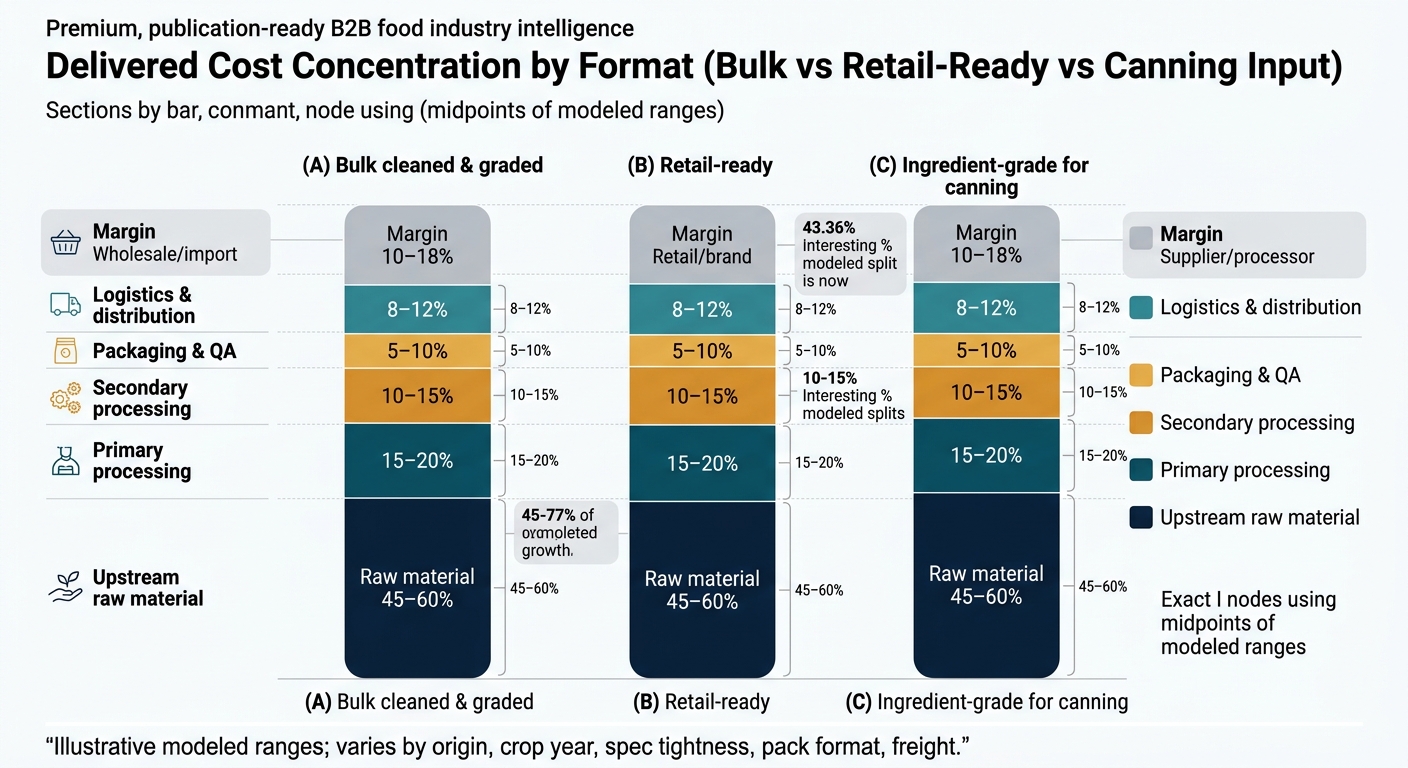
Below is a procurement-oriented “margin map” of where cost accumulates and where suppliers earn (or lose) money.

2.1 Upstream / Raw Material (Farmgate & aggregation)

Key insight: Farm-level variability determines what primary processors can actually turn into exportable/retail-grade lots.

What drives your eventual landed cost:

  • Yield and harvested quality: weather at maturation/harvest can increase splits, staining, discoloration, and mold risk, reducing exportable grade.
  • Moisture at harvest: higher moisture increases storage risk and can trigger discounts/claims later.
  • Local demand pull: domestic demand and nearby buyers can tighten supply even when global availability looks “fine.”

Procurement implication: When the crop is “average” on volume but below-average on grade, you will see FOB prices hold up (or rise) even if farmgate prices soften—because processors are losing yield in sorting.

2.2 Primary Processing (cleaning, grading, sorting, blending)

Key insight: Primary processing is where “commodity” becomes “spec.” This node controls defect economics.

Cost & margin drivers:

  • Optical sorting and cleaning throughput: energy + labor + capex utilization.
  • Shrink/yield loss: removing foreign material, damaged beans, splits, contrasting classes.
  • Blending capability: the ability to blend lots to meet color/size/defect specs reduces risk and stabilizes supply.

Specs are real money: A tighter spec can increase removal rates and reduce available supplier pool; the price impact is not linear.

Reference spec reality (not illustrative): USDA commodity specifications for dry edible beans explicitly define tight parameters for particular deliveries (e.g., moisture ranges and very low foreign material/defect thresholds for some items) and require grade U.S. No. 1 for many deliveries, with inspection tied to FGIS documentation. [1]

2.3 Secondary Processing (optional): splits, flour, quick-cook, canning input)

Key insight: Secondary processing changes your risk profile: you trade higher conversion cost for more consistent functionality.

Cost & margin drivers:

  • Milling/pre-cook energy costs and yield.
  • Food safety and QA intensity increases (micro, allergen cross-contact controls, traceability).
  • Byproduct value: broken beans/screenings can be monetized into feed/low-grade channels, partially offsetting shrink.

Procurement implication: If your downstream cost of failure is high (rework, line downtime, customer complaints), secondary-processed options can reduce total cost even when unit price is higher.

2.4 Packaging & QA (bulk vs retail-ready; compliance)

Key insight: Packaging is not just materials—it’s lot integrity + claims prevention.

Cost & margin drivers:

  • Pack format: 25–50 kg sacks vs 1-ton FIBCs vs retail pouches.
  • QA documentation: COAs, pesticide residue where applicable, supplier food safety systems.
  • Moisture/infestation prevention: liners, desiccants (lane-dependent), and pest control protocols.

Procurement implication: The cheapest pack is often the most expensive after claims—especially if moisture ingress or infestation triggers rejections.

2.5 Logistics & Distribution (inland + ocean + destination handling)

Key insight: Beans ship well when dry and protected, but they are highly sensitive to moisture ingress, odor contamination, and delay.

Cost & margin drivers:

  • Inland freight basis (farm region → processor → rail/port). This can dominate landed cost swings.
  • Container availability / port dwell time: increases demurrage and risk of moisture exposure.
  • Working capital: beans can be stored, but inventory is not free—financing cost matters.

Procurement implication: A “good FOB” can be a bad landed cost if inland basis and congestion are moving against you.

2.6 End market margin (importer/wholesaler/retail or industrial conversion)

Key insight: Downstream players price in service reliability and quality consistency. If your supply is unstable, you pay a premium in expediting, substitutions, and customer penalties.

Stacked bar chart comparing delivered cost concentration by format (bulk cleaned & graded, retail-ready, ingredient-grade for canning), segmented by upstream raw material, primary processing, secondary processing, packaging & QA, logistics & distribution, and margin, with range annotations and a footnote noting illustrative modeled ranges.

Node-by-node cost ratio table (illustrative, modeled ranges)

These are modeled ranges to show where cost concentrates. Actual ratios vary by origin, crop year, spec tightness, pack format, and freight. Use them to focus negotiations (what to ask, what to audit), not as a universal should-cost.

A) Bulk cleaned & graded beans (25–50 kg sacks, foodservice/industrial)

Supply chain node Cost ratio (% of delivered cost) What moves it most
Upstream raw material 45–60% crop yield/grade, farmgate price, FX
Primary processing 10–18% sorting yield loss, optical sorting intensity
Secondary processing 0% N/A
Packaging & QA 3–7% sack/liner choice, QA/testing
Logistics & distribution 12–22% inland basis, ocean freight, demurrage
Wholesale/import margin 8–15% service level, credit terms

B) Retail-ready dry beans (0.5–2 kg pouches)

Supply chain node Cost ratio (% of delivered cost) What moves it most
Upstream raw material 30–45% crop year spreads by class
Primary processing 10–16% defect removal and blending
Secondary processing 0% N/A
Packaging & QA 12–22% film, printing, labor, compliance
Logistics & distribution 10–18% destination DC complexity
Retail/brand margin 12–25% promo cadence, service reliability

C) Ingredient-grade for canning (consistent hydration/cook performance)

Supply chain node Cost ratio (% of delivered cost) What moves it most
Upstream raw material 35–50% variety availability, grade
Primary processing 12–20% size uniformity, defect limits
Secondary processing 0–10% optional conditioning, additional QA
Packaging & QA 4–10% bulk handling, COA rigor
Logistics & distribution 12–20% inland + ocean + scheduling
Supplier/processor margin 8–15% performance expectations, penalties

3) One structural fact that changes negotiations: “spec yield” is the hidden lever

Structural fact: In dried beans, the market often clears on exportable/retail-grade availability, not on total harvested tonnage.

That means two suppliers quoting the “same origin and same bean class” can have very different economics depending on:

  • Their cleaning/sorting yield (how much field-run becomes your spec)
  • Their blending inventory (ability to build consistent lots)
  • Their defect risk controls (storage moisture management, infestation prevention)

Management takeaway: If you only benchmark on price/MT, you miss the biggest driver of supplier behavior: how much margin they must earn to cover shrink and claims.

4) The critical insight: why bean prices can move even when the crop looks “fine”

Procurement teams often expect a simple story: “big crop = lower price.” Beans break that logic because quality and storability create a second dimension.

Three common “disconnect” mechanisms:

  1. Grade scarcity: If harvest conditions increase splits/staining/foreign material, primary processors lose yield to hit spec. FOB stays firm even if farmgate softens.
  2. Storage-driven quality decay: Poor storage conditions (high temperature/humidity) can create hard-to-cook (HTC) and related defects, increasing functional risk and pushing buyers toward fresher or better-controlled lots. Peer-reviewed and extension sources link HTC development to adverse storage conditions (temperature/humidity) and time. [2]
  3. Logistics basis shocks: Inland freight/rail/port issues can widen basis quickly, changing landed cost without an obvious change in “global price.”

Procurement implication: Your negotiation posture should be anchored to (a) grade availability, (b) logistics basis, (c) supplier sorting yield, not only a generic market index.

5) Where procurement teams typically get dried beans wrong (and pay for it)

These are repeatable failure modes when teams are experienced procurement leaders—but new to beans.

  1. Treating all suppliers as interchangeable
  2. Reality: cleaning/sorting capability and blending inventory create real performance differences.
  3. Over-tight specs without a tiering strategy
  4. Outcome: fewer qualified suppliers, higher dependency, and higher price volatility in tight years.
  5. Buying “spot” while assuming beans are risk-free because they store well
  6. Reality: storage can protect supply but can also degrade cookability and color, increasing claim risk. [3]
  7. Underweighting inland logistics
  8. Outcome: “good FOB” turns into “bad landed,” plus missed delivery windows.
  9. No governance-ready supplier scorecard
  10. Outcome: supplier changes become political, slow approvals, and weak audit trails.

6) What changes when you run beans like an intelligence-led category (not a reactive one)

Start from the decision you need to make, then apply only the intelligence that improves that decision.

Decision A: Lock forward coverage now vs stay spot (volatility control)

Use price intelligence & market drivers to separate:

  • market movement (crop/grade signals, basis) vs.
  • supplier margin expansion

Outcome: lower price variance vs benchmark; fewer emergency buys.

Decision B: Add a second origin/supplier without increasing quality escapes (resilience)

Use supplier discovery + benchmarking to build a qualified bench by:

  • origin (diversify weather/policy risk)
  • capability (optical sorting, blending, pack formats)
  • compliance posture (documentation discipline)

Outcome: reduced concentration risk; faster time-to-switch.

Decision C: Adjust spec tiers to increase optionality (quality vs resilience trade-off)

Use alternative identification + benchmarking to build a two-tier strategy:

  • Tier 1: critical SKUs (tight color/defect/cook performance)
  • Tier 2: flexible SKUs (slightly broader tolerances)

Outcome: fewer stockouts and fewer quality incidents on the SKUs that matter most.

Governance: make it auditable

Use performance analysis to standardize:

  • OTIF, claim rate, defect trends
  • corrective actions and QBR agendas
  • approval rationale for supplier additions/volume shifts

Outcome: faster approvals; clearer supplier accountability.

7) Strategic use cases procurement leaders can operationalize in 90 days

  1. Build a “standing bench” of alternates by bean class
  2. Target: 2–3 qualified suppliers per critical bean class (pinto/black/navy/kidney)
  3. Include at least two origins where feasible
  4. Implement a bean-specific supplier scorecard
  5. OTIF (by lane)
  6. COA accuracy & documentation cycle time
  7. Defect performance (foreign material, splits, insect damage)
  8. Lot consistency (color/size uniformity)
  9. Claims responsiveness
  10. Create a coverage policy tied to risk signals
  11. Define triggers (crop/grade risk, logistics congestion, supplier capacity flags)
  12. Define actions (increase forward coverage, expand inventory buffer, shift allocations)
  13. Run a spec tiering workshop with QA + Ops
  14. Output: which parameters are truly critical vs negotiable
  15. Result: broader supplier pool without increasing downstream failures

8) Why this matters beyond beans (examples your team likely also buys)

The “beans lesson” generalizes: quality yield + logistics basis + governance often dominate unit price.

  • Rice: head rice yield vs broken % drives real value; logistics and milling yield create price spreads.
  • Nuts (e.g., almonds/cashews): defect sorting yield and grade scarcity cause price disconnects vs raw supply.
  • Spices (e.g., paprika/pepper): contamination risk and compliance testing can be the real constraint, not farm volume.
  • Tomato paste / fruit concentrates: brix/spec and industrial conversion yields create non-linear pricing.

If you treat these as “simple commodities,” you’ll repeatedly pay hidden premiums (claims, expediting, line downtime) that never show up in your bid sheet.

9) Why this example is powerful for procurement intelligence buyers

Dried common beans are a clean demonstration of what procurement intelligence should do:

  • Convert agronomic + logistics noise into decisions (coverage timing, allocation, inventory posture)
  • Make quality economics explicit (sorting yield, spec tiering, claim probability)
  • Reduce dependency risk with governance (auditable supplier additions, performance-based allocation)

How you measure success (management-ready KPIs):

  • Price variance vs benchmark (by class/origin)
  • OTIF and lead-time stability (by lane)
  • Quality claim rate (foreign material/splits/insect issues)
  • Rejection/rework incidents (plant-level)
  • Supplier concentration index (share of volume by top supplier/origin)
  • Time-to-switch (days from trigger to first compliant delivery)
Tridge Eye Data Intelligence Solution

Make Faster, Data-Driven Sourcing Decisions

The insights in this report are just the starting point. Tridge Eye is the data intelligence solution that gives procurement and sourcing leaders real-time market signals, price benchmarks, and supply risk alerts — so you can act before the market moves.

Explore Tridge Eye →

References

  1. ams.usda.gov
  2. sciencedirect.com
  3. tandfonline.com
Subscribe
By subscribing you agree to with our Privacy Policy and provide consent to receive updates from our company.
Thank you! Your submission has been received!
Oops! Something went wrong while submitting the form.
Subscribe to receive the latest blog posts, updates, promotions, and announcements from Tridge.