INDUSTRY TRENDS

Dehydrated Strawberry Supply Chain Map, Structural Bottlenecks, and Cost Drivers (Procurement Guide)

Author
Team Tridge
DATE
June 24, 2026
7 min read
dehydrated-strawberry Cover
Dehydrated Strawberry
Powered by Tridge Eye
🇺🇦 Ukraine↓ 7.5%
$6.50/kg
Wholesale reference prices across 30 markets

Dehydrated strawberry looks like a simple “dry ingredient,” but your cost, quality, and continuity are actually set by a system: seasonal fruit, (often) a frozen buffer, energy-intensive drying, and moisture-protective packaging. This guide maps where costs lock in, what typically goes wrong, and which spec/contract levers procurement can use to reduce surprises without over-constraining supply.

Executive Summary

  • Seasonality is structural: Most “year-round” supply is built on seasonal harvest plus IQF/frozen blocks as a buffer.
  • Drying choice drives behavior: Freeze-dried (very low moisture/aw) is crisp but moisture-sensitive; air-dried/infused behaves differently in yogurt, bakery, and confectionery.
  • Packaging is a process control: FDA notes aw must be achieved at drying and maintained during storage—so barrier packaging and warehouse discipline are part of quality assurance. [1]
  • Upstream hubs matter: Egypt is a top exporter of frozen strawberries (HS 081110) in 2024 trade data, which can influence downstream ingredient availability and conversion economics. [2]

1) How the Physical Supply Chain Is Built (and Where Costs “Lock In”)

Dehydrated strawberry is not a single product—it’s a family of formats (air-dried pieces, freeze-dried pieces, infused/sweetened pieces, granules, powders) built on the same physical reality: a short harvest window feeding year-round industrial drying. Many suppliers decouple seasonality by converting fresh berries into IQF/frozen blocks first, then drying later when capacity and energy economics allow.

Insight: The chain’s fixed cost-drivers are set early (harvest labor + solids content/Brix) and again at the drying step (energy + time + yield loss).

Data (validated): FDA emphasizes that water activity affects stability and must be brought to a suitable level at the conclusion of drying and maintained within an acceptable range during storage. [1]

Procurement Impact: If you don’t know whether your supplier dries from fresh vs. frozen intermediate—and which drying technology they use—you can’t interpret lead times, conversion yields, or why two “strawberry pieces” behave differently in your finished product.

Typical physical flow (most common industrial pattern):
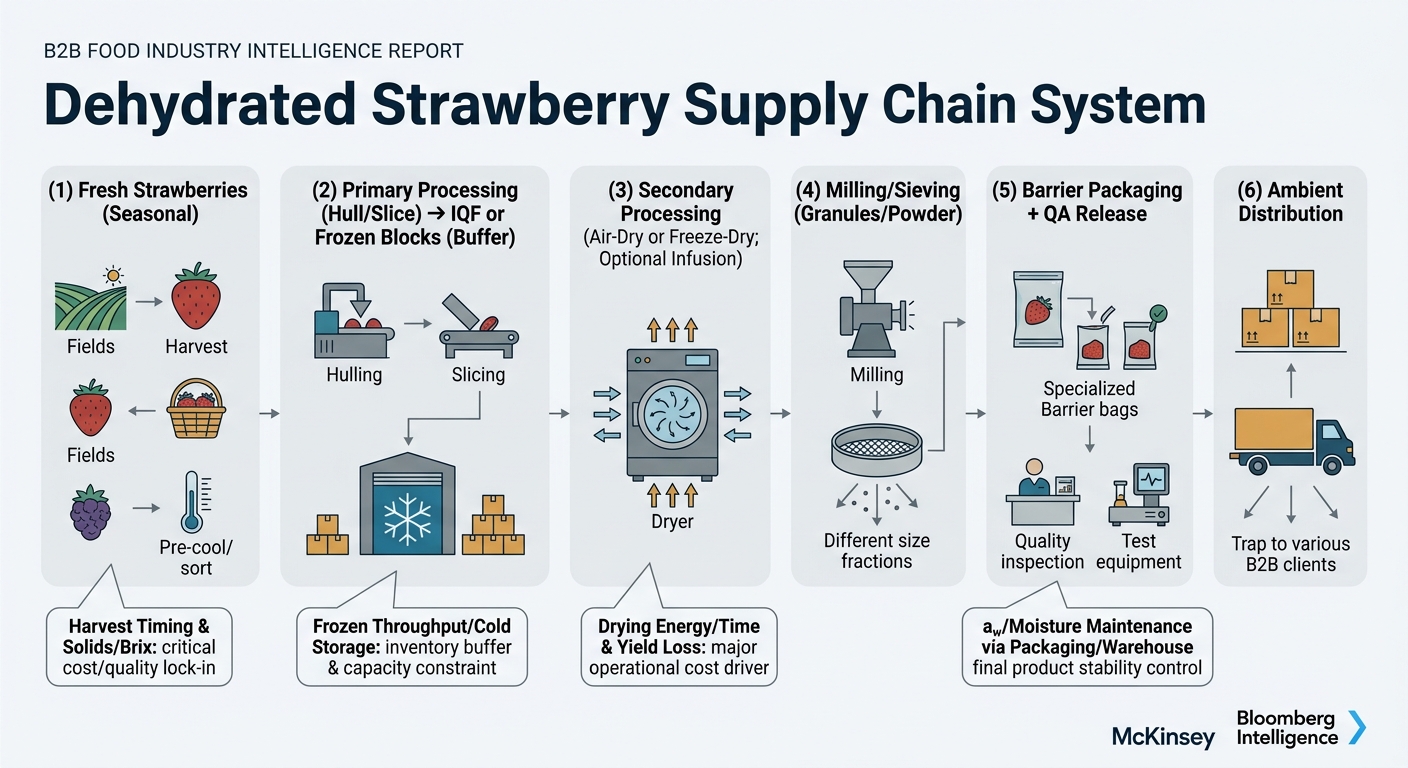
  • Fresh strawberries (seasonal) → pre-cool/sort →
  • Primary processing (hull/slice) → IQF or frozen blocks (buffer) →
  • Secondary processing (air-dry or freeze-dry; optional infusion) →
  • Milling/sieving (granules/powder) →
  • Barrier packaging + QA release → ambient distribution
A left-to-right supply chain flow showing the most common industrial pattern: (1) Fresh strawberries (seasonal) → pre-cool/sort, (2) Primary processing (hull/slice) → IQF or frozen blocks (buffer), (3) Secondary processing (air-dry or freeze-dry; optional infusion), (4) Milling/sieving (granules/powder), (5) Barrier packaging + QA release, (6) Ambient distribution. Callout boxes highlight key cost/quality lock-in points: harvest timing & solids/Brix; frozen throughput/cold storage; drying energy/time & yield loss; aw/moisture maintenance via packaging/warehouse discipline. Simple icons (berry, snowflake, dryer, sieve, barrier bag, truck) and no dashboard-like UI.

2) Where Cost and Margin Accumulate (Node-by-Node)

Insight: Dehydrated strawberry cost is cumulative: each node adds unavoidable conversion loss (trim + moisture removal), plus compliance and packaging to protect a highly hygroscopic product.

Data (validated, corrected framing): Trade data for HS 081110 (frozen strawberries) shows Egypt among the top exporters in 2024. Procurement should treat this as an upstream influence (frozen input availability/quality), not a guarantee that dehydrated supply is “Egypt-based.” [2]

Procurement Impact: Even when you buy “dehydrated,” upstream frozen supply hubs and cold-chain constraints still shape availability, quality consistency, and the true conversion economics.

1. Upstream / Raw Material (Farming + Harvest)

  • Insight: Strawberries are labor- and timing-sensitive; fruit maturity and rapid cooling largely determine color/flavor retention and microbial starting load.
  • Data: The chain is structurally seasonal; processors often divert processing-grade fruit from fresh markets and must move fruit quickly into cooling and processing to limit deterioration.
  • Procurement Impact: Farm-level variability shows up downstream as lot-to-lot color, flavor intensity, and yield (more trim + more fines). Your “same spec” can behave differently if solids content and ripeness shift.

2. Primary Processing (Sorting, Hulling, Slicing; Often IQF/Frozen Buffer)

  • Insight: This node turns a perishable fruit into a storable industrial input; it is where foreign material control and defect sorting become cost and risk anchors.
  • Data (validated, de-risked): 2024 trade statistics show Egypt as the largest exporter by value for frozen strawberries (HS 081110), alongside other major exporters (e.g., Mexico, Poland, Chile, China). [2]
  • Procurement Impact: If your dehydrated supplier relies on IQF/frozen intermediates, cold storage, freezer throughput, and inbound fruit grading standards become hidden drivers of lead time and defect rates.

3. Secondary Processing (Drying: Air-Dried vs. Freeze-Dried; Optional Infusion)

  • Insight: Drying technology is the biggest structural fork in cost, texture, and stability. Freeze-drying preserves structure/color but is energy- and cycle-time intensive; air/hot-air drying is cheaper but tends to shrink/darken and can shift flavor.
  • Data (validated at principle level): Freeze-dried fruit is typically specified at very low moisture and low aw to maintain crispness and stability; exact targets vary by supplier, cut size, and packaging. (Procurement should require supplier COAs for the agreed targets rather than assume universal numbers.)
  • Procurement Impact: Your application fit (granola vs. yogurt vs. baked bar) is physically determined here: low-aw crisp pieces can quickly pick up moisture in humid environments; air-dried/infused pieces behave more like intermediate-moisture inclusions.

4. Size Reduction + Classification (Granules, Powders, Fines Control)

  • Insight: Milling and sieving look “simple,” but they are where yield loss (fines), dust handling, and size distribution control become material—especially for dry blending and visual inclusions.
  • Data (kept, but generalized): Supplier technical sheets commonly emphasize particle size distribution and moisture protection for dried fruit fragments/powders because performance shifts quickly with humidity exposure.
  • Procurement Impact: If your spec doesn’t explicitly control “fines,” you can see batch-to-batch color shift in blends, higher dusting losses, and inconsistent inclusion counts per unit.

5. Packaging, QA Release, and Ambient Logistics (Keeping aw Where It Was)

  • Insight: Dehydrated strawberry is hygroscopic; packaging is not a commodity add-on—it is an engineered control to prevent moisture pickup, oxidation, and texture loss.
  • Data (validated): FDA notes aw affects stability and must be achieved at the conclusion of drying and maintained during storage—supporting the idea that packaging/handling are part of the control plan. [1]
  • Procurement Impact: Barrier bags/liners, nitrogen flushing (where used), and moisture control during warehousing are part of “manufacturing,” not just shipping—because a small aw increase can convert crisp pieces into leathery inclusions and raise mold risk.
Three 100% stacked bars comparing cost stacks by product type: A) Freeze-Dried Pieces, B) Air-Dried/Dehydrated Pieces (Unsweetened), C) Infused/Sweetened Pieces. Each bar is stacked by supply chain node: Raw Material, Primary Processing + (Optional) Frozen Buffer, Secondary Processing (Drying/Infusion), Milling/Sieving (if applicable), Packaging & QA, Logistics & Distribution. Uses illustrative midpoint ratios or shows ranges with thin whiskers/labels, includes a legend, and notes: “Illustrative ratios; varies by cut size, spec, and supplier.” No dashboard styling.

Product-Level Cost Breakdown (Illustrative Ratios)

A) Freeze-Dried Strawberry Pieces (Slices/Dice)

Supply Chain Node Cost Ratio (% of Final Cost) Notes
Raw Material (fresh fruit equivalent) 20–30% Solids/Brix and defect sorting affect usable yield.
Primary Processing + IQF/Frozen Buffer 10–18% Freezing energy, cold storage, grading/foreign material control.
Secondary Processing (Freeze-Drying) 30–45% Dominated by electricity/refrigeration, long cycle times, capex recovery.
Milling/Sieving (if applicable) 3–8% Fines loss + classification to tight size bands.
Packaging & QA 8–15% High-barrier laminates, metal detection/X-ray, micro + aw/moisture verification.
Logistics & Distribution 5–12% Humidity/temperature protection; longer routes increase exposure risk.

B) Air-Dried / Dehydrated Strawberry Pieces (Unsweetened)

Supply Chain Node Cost Ratio (% of Final Cost) Notes
Raw Material 25–40% Higher dependence on fruit price because drying is less capex-intensive than FD.
Primary Processing + (Optional) Frozen Buffer 8–15% Many still use frozen intermediates to smooth seasonality.
Secondary Processing (Air/Hot-Air Drying) 18–30% Thermal energy + throughput; quality losses can rise with higher heat.
Milling/Sieving (if applicable) 3–8% Controls granule uniformity and blend behavior.
Packaging & QA 8–15% Moisture barrier still critical; micro and foreign material controls.
Logistics & Distribution 6–12% Ambient freight but humidity-sensitive.

C) Infused/Sweetened Dried Strawberry Pieces (Intermediate-Moisture Style)

Supply Chain Node Cost Ratio (% of Final Cost) Notes
Raw Material 20–35% Fruit quality still matters, but infusion can mask some variability.
Primary Processing 8–14% Cutting uniformity affects infusion kinetics and finished texture.
Infusion + Drying 20–35% Sugar/humectant inputs + controlled drying to target chew and stability.
Packaging & QA 10–18% Stickiness and moisture migration require robust packaging and handling.
Logistics & Distribution 6–12% Temperature cycling can increase clumping/stickiness.
Sourcing Window Radar
Dehydrated Strawberry — Global Harvest Calendar
CHINA SEASON ACTIVE
🇨🇳 China
JUN — DEC
🇵🇪 Peru
AUG — DEC
🇹🇷 Turkey
AUG — DEC
🇺🇸 United St.
JUN — OCT
🇻🇳 Vietnam
AUG — OCT
JanFebMarAprMayJunJulAugSepOctNovDec

3) Structural Realities Every Buyer Inherits (Whether You Like Them or Not)

Insight: Dehydrated strawberry supply is constrained less by “factory capacity in general” and more by synchronized bottlenecks: harvest timing, freezing throughput (if used), and drying energy/time.

Data (validated, grounded in trade reality): 2024 trade data shows concentration in upstream frozen strawberry exports among a handful of origins (Egypt, Mexico, Poland, Chile, China), which can feed downstream ingredient manufacturing globally. [2]

Procurement Impact: Your continuity risk is partly a geography-and-infrastructure problem, not just a supplier problem.

Structural Fact #1: Most “year-round” dehydrated supply is built on seasonal inventory.

  • Insight: Dryers run year-round, but fruit does not. Frozen intermediates (IQF/blocks) are a structural bridge.
  • Data: Frozen strawberry export concentration is visible in HS 081110 trade data, reinforcing why frozen buffering is a common industry mechanism. [2]
  • Procurement Impact: Any disruption in freezing/cold storage availability can echo later as “dehydrated shortages,” even if drying plants are operational.

Structural Fact #2: Water activity is a packaging problem as much as a drying problem.

  • Insight: aw is not “set and forget”; dehydrated fruit equilibrates with ambient humidity.
  • Data (validated): FDA explicitly frames aw as something that must be achieved at drying and maintained through storage. [1]
  • Procurement Impact: Warehouse conditions, liner integrity, and reseal behavior can change texture and microbial risk without any change in supplier’s dryer settings.

Structural Fact #3: “Same cut size” does not mean “same functionality.”

  • Insight: Drying method, porosity, infusion, and fines content drive how pieces behave in fat systems (chocolate), wet systems (yogurt), and baked systems.
  • Data (validated at principle level): Lower-aw, lower-moisture products are generally more moisture-seeking and can lose crispness quickly if packaging/handling allow humidity pickup; therefore functional specs must accompany visual specs.
  • Procurement Impact: Without functional specs (aw, moisture, bulk density, fines), you inherit line issues: sogginess, bleeding, clumping, or inconsistent inclusion counts.

Key Insights (What to Remember When You Look at Any Supplier Offer)

  • Insight: The “true factory” for dehydrated strawberry is a system (field → cold chain → dryer → barrier pack), not a single plant.
  • Data (validated): FDA’s aw guidance supports treating drying plus storage/packaging as one control continuum, not separate responsibilities. [1]
  • Procurement Impact: If your internal spec only lists cut size and color, you are missing the two parameters most tied to shelf-life and performance: water activity and packaging barrier integrity.

4) The Bottom Line for Your Next Contract

(Analyzed at: Jun, 2026) The most reliable way to reduce “mystery failures” (soggy inclusions, clumping, mold complaints) is to contract dehydrated strawberry as a functional system spec: lock aw/moisture targets and require evidence they’re maintained through storage via defined packaging (barrier film, liner, reseal expectations) and documented warehouse conditions. This works because FDA’s own framing treats aw as a stability lever that must be achieved at drying and maintained during storage, so your supplier’s dryer settings alone won’t protect you. [1]

What’s at stake is usually not the cents-per-pound delta—it’s the avoided cost of rework, scrap, and expedited replacement lots that show up when a “like-for-like” substitute isn’t actually like-for-like in aw and packaging performance.

Unlock Full Data
Dehydrated Strawberry Market Intelligence
Prices · Trends · Origins · Forecasts

References

  1. fda.gov
  2. wits.worldbank.org

Related Contents

Subscribe
By subscribing you agree to with our Privacy Policy and provide consent to receive updates from our company.
Thank you! Your submission has been received!
Oops! Something went wrong while submitting the form.
Subscribe to receive the latest blog posts, updates, promotions, and announcements from Tridge.