INDUSTRY TRENDS

Corn Procurement: Where Your Delivered Price Really Comes From (Futures, Basis, Freight, Quality)

Author
Team Tridge
DATE
March 16, 2026
8 min read
Corn (Maize) Cover
Tridge Eye Data Intelligence Solution

This report is powered by Tridge Eye Data Intelligence.

Every data point, price signal, and supply risk insight in this analysis comes from the same platform that procurement and sourcing leaders worldwide rely on daily. As you read, consider what this level of market intelligence could do for your sourcing decisions.

Explore Tridge Eye →

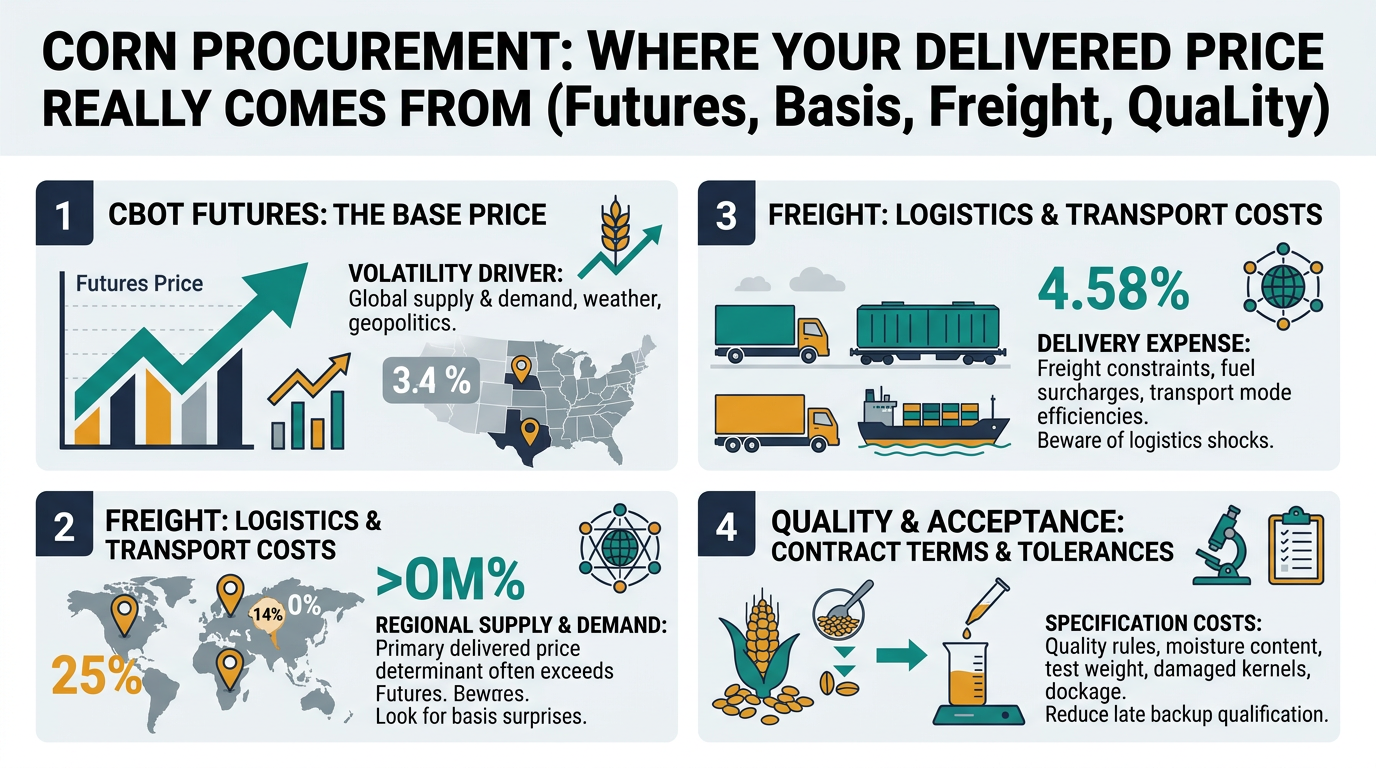
Corn looks like a single commodity on a screen, but your delivered price is usually driven by local basis, freight constraints, and quality/acceptance rules as much as (and sometimes more than) CBOT futures.

This guide is written for procurement and sourcing leaders who know procurement well but don’t live inside corn markets every day. It translates “market intelligence” into practical actions: how to interrogate quotes, structure contracts, reduce volatility, and avoid the common failure modes (basis surprises, logistics shocks, and late backup qualification).

Executive Summary

  • Delivered price is a stack, not a number: Most physical buys behave like CBOT futures + local basis + freight/handling + quality adjustments + supplier margin (cash market mechanics are standard in U.S. grain merchandising).
  • Basis is where budgets blow up: You can be “right” on futures hedging and still miss your budget due to basis and freight moves.
  • Ethanol matters, but don’t use the wrong headline: Public commentary often cites ~40% of the crop; USDA ERS notes ethanol is roughly ~45% of total U.S. corn use (usage share, not “net disappearance” after co-products). [1]
  • Logistics shocks are recurring, not rare: Mississippi River disruptions have repeatedly widened spatial basis relationships and pushed barge rates sharply higher, impacting interior cash markets and delivered costs. [2]
  • Practical next step (this week): Build a one-page delivered-cost should-cost template for your top lanes (futures month, basis range, freight benchmark, handling/inspection, quality schedule) and use it to re-score supplier quotes and allocation rules.

Key Insights

Analyzed at: Mar, 2026

Corn (Maize) Infographic
  • Strategy: Hold
  • Reliability: Medium
  • Potential Saving: 3% ~ 8%

USDA and market commentary through 2025/26 continue to point to a structurally large U.S. supply base and meaningful ethanol-driven domestic demand. The consistent procurement opportunity is less about “calling the futures” and more about governing basis and freight: (1) tighten index discipline (CBOT month, roll rules), (2) add basis blowout triggers and route optionality (rail vs truck vs barge), and (3) pre-qualify alternates before the next logistics/weather event. This is typically where multi-plant buyers can capture mid-single-digit savings and reduce budget variance without increasing stockout risk. [1]

1) What You’re Actually Buying: The Real Corn Supply Chain (Ground Truth)

Corn looks like a single commodity, but procurement outcomes are driven by where it’s sourced, how it moves, and what channel you buy through.

The practical flow (U.S.-anchored, global links):

A left-to-right flow diagram showing U.S. corn physical flow from farm production to country elevator/merchandiser, domestic demand pull (ethanol/feed/wet mill), inland logistics (truck/rail/barge), export terminals (Gulf/PNW), and end use (feed, ethanol, food/industrial), with callouts indicating where basis forms and where freight constraints reprice delivered cost.
  1. Farm production (harvested grain) → moisture management + storage quality determine marketability.
  2. Country elevator / merchandiser aggregation → drying, grading, blending, and storage; sets many local discounts/premiums.
  3. Domestic demand pull (ethanol plants, feed mills, wet mills) → concentrated assets can tighten local basis even when futures are flat.
  4. Inland logistics (truck / rail / barge) → one of the biggest “silent” drivers of delivered cost volatility.
  5. Export terminals (Gulf / PNW) & global trade → global balance sheet transmits quickly through futures; local constraints show up in basis.
  6. End use
  7. Feed (livestock integrators, feed mills)
  8. Fuel ethanol (and DDGS/corn oil co-products)
  9. Food & industrial (starch, sweeteners, corn oil, beverage/industrial alcohol)

Two procurement realities that matter immediately:

  • Your price is usually “CBOT futures + basis + freight + handling + margin.” Basis is the variable that surprises non-corn categories most often.
  • Demand is structurally split between feed and ethanol. USDA ERS notes ethanol accounts for nearly ~45% of total U.S. corn use (a usage-share framing). That means fuel economics and policy can move local demand and basis—not just “crop size.” [1]

2) Where Cost and Margin Accumulate (Node-by-Node, What to Challenge)

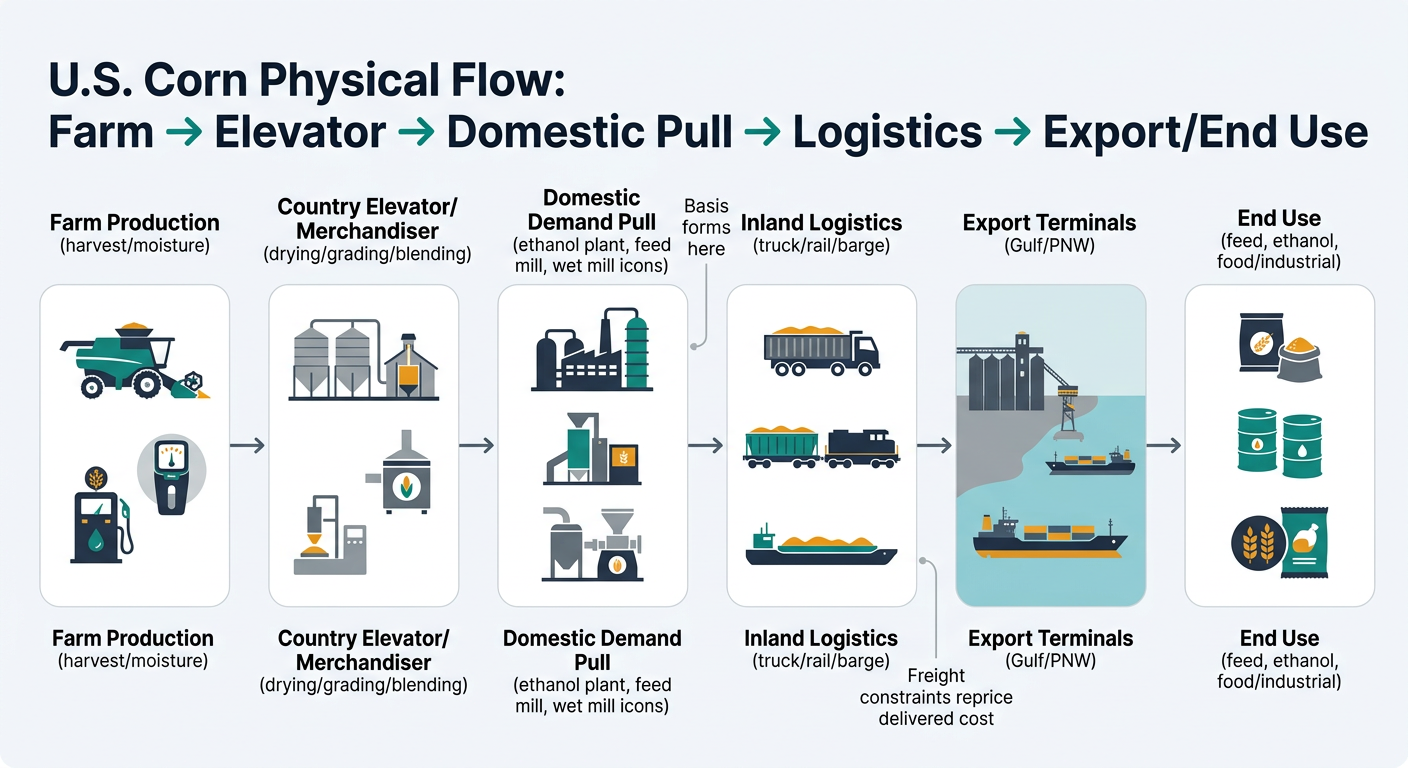
Below is the same supply chain, but rewritten as a procurement cost stack you can interrogate.

2.1 Upstream: Farming & On-Farm Storage (Raw Grain)

Key insight: Farm-level corn cost is dominated by yield risk and input costs, but your procurement volatility shows up later—mainly via basis and logistics.

What really moves cost here:

  • Yield shocks (weather) change national and regional supply expectations.
  • Harvest conditions affect moisture and damage → more drying, more shrink, higher quality risk.

Procurement watch-outs:

  • “Cheap” origin can become expensive if harvest quality forces rejection/diversion (especially for food-grade or mycotoxin-sensitive feed programs).

2.2 Primary Handling: Elevators / Merchandisers (Drying, Grading, Storage)

Key insight: Elevators monetize optionality—blending, timing, and logistics access. Their margin often widens when logistics are constrained.

Cost drivers you can decompose:

  • Drying fuel (propane/nat gas), shrink, storage carry
  • Grade factors: test weight, BCFM, total damage, moisture

2.3 Secondary Processing Pull: Ethanol / Wet Mills / Feed Mills

Key insight: Local processors create “gravity wells.” When plants run hard (or go down), local basis can move more than futures.

Ethanol is a swing factor:

  • Ethanol is a large and persistent demand component; USDA ERS describes it as nearly ~45% of total corn use in recent years. Don’t treat that as “40% of the crop disappears from the food system,” because co-products (e.g., DDGS) return feed value to livestock rations. [1]

2.4 Packaging & QA (Often Ignored Until It Breaks)

Key insight: Bulk grain has “minimal packaging,” but QA is a real cost center when specs tighten.

QA cost drivers:

  • Mycotoxin testing (DON, aflatoxin) and retention samples
  • Identity preservation (non-GMO/organic) adds segregation, testing cadence, and audit burden

Operational constraint:

  • Tight specs can reduce your supplier universe quickly; qualification lead times become the bottleneck, not price.

2.5 Logistics & Distribution (Where Volatility Hides)

Key insight: River, rail, and truck constraints can reprice corn without any change in CBOT futures.

A concrete example procurement teams can relate to:

  • Low Mississippi River levels have driven barge constraints and sharply higher barge rates. Research and reporting show these shocks widen Gulf vs inland basis relationships and disrupt normal cash price patterns. [2]

What to track as a buyer:

  • Corridor-level freight (barge tariffs, rail service metrics, truck capacity)
  • Route optionality (Gulf vs PNW exposure, rail-to-Mexico lanes)

2.6 End Markets & Channel Margins (Trader / Distributor / Processor)

Key insight: Channel choice changes transparency.
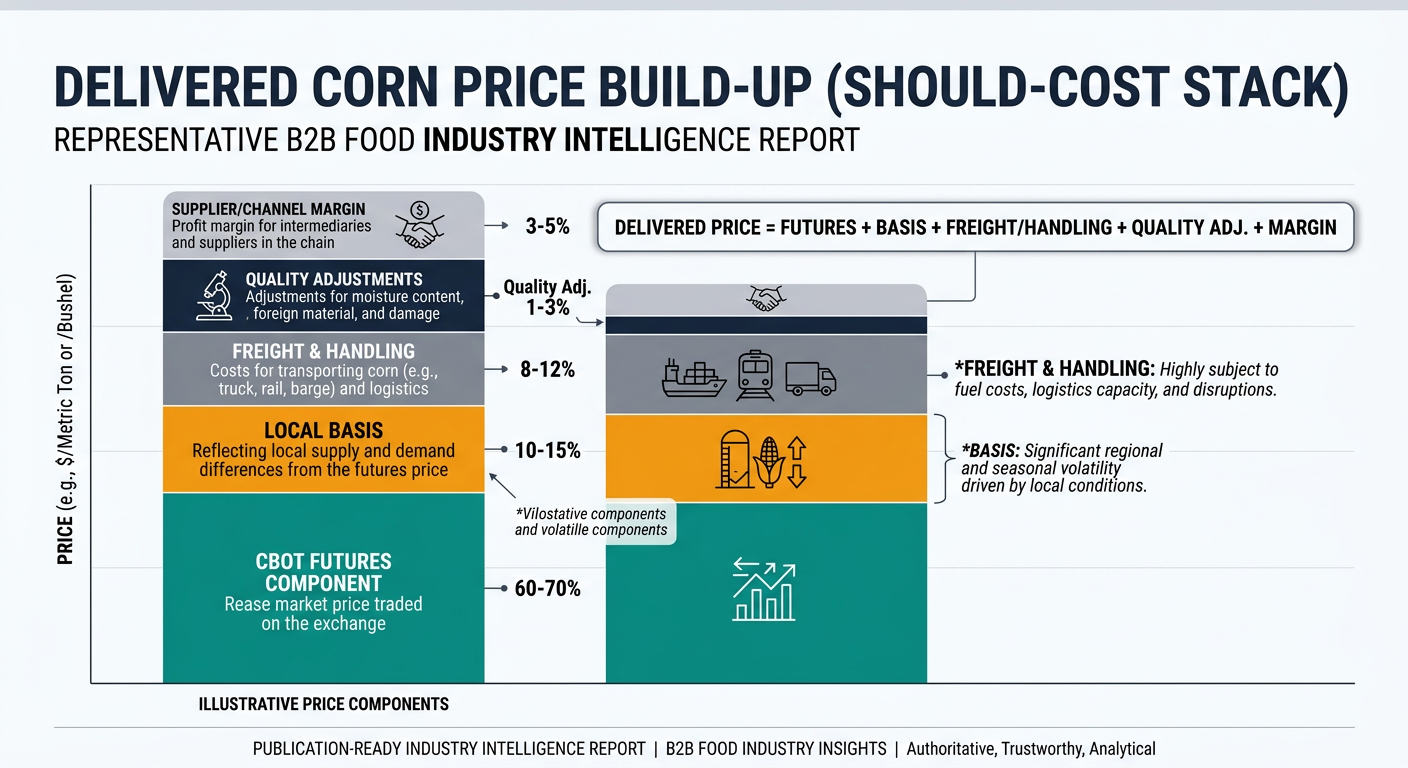
  • Buying delivered plant through a merchandiser can bundle basis, freight, and risk premium.
  • Buying FOB origin increases your control but shifts execution risk to your team.

Product-Level Cost Breakdown (Illustrative, Delivered Cost Shares)

A) No. 2 Yellow Corn (Bulk, Domestic Delivered)

Supply Chain Node Cost Ratio (% of Delivered Cost) Notes
Farm value (commodity) 55% Futures-driven component dominates long-run level
Primary handling (elevator) 10% Drying, shrink, storage, merchandising margin
Secondary processing margin 0% N/A (grain, not processed)
Packaging & QA 3% Sampling, grading, mycotoxin screens as needed
Logistics & distribution 20% Truck/rail/barge + handling; most volatile locally
Channel margin / risk premium 12% Depends on supplier, service level, optionality

B) Non-GMO Corn (Identity-Preserved, Delivered)

Supply Chain Node Cost Ratio (% of Delivered Cost) Notes
Farm value (commodity + premium) 50% Premium reflects segregation + program demand
Primary handling (segregation) 15% Dedicated bins, cleaning, documentation
Secondary processing margin 0% N/A
Packaging & QA 7% Testing cadence, traceability, audits
Logistics & distribution 18% Fewer lanes/suppliers can raise freight
Channel margin / risk premium 10% Higher when supply is tight

C) Corn for Ethanol-Adjacent Supply (Basis Sensitive Regions)

Supply Chain Node Cost Ratio (% of Delivered Cost) Notes
Farm value (commodity) 52% Futures + local supply
Primary handling 9% Similar to standard
Secondary processing pull effect 0% Not a direct cost line—shows up as basis
Packaging & QA 3% Standard grading/testing
Logistics & distribution 16% Often shorter-haul to plants
Basis / local market premium 20% Captures processor competition for bushels

3) Structural Fact You Need in Your Category Strategy: Corn Is Two Markets at Once

Corn procurement behaves like:

  • A global financial commodity (CBOT price discovery, global balance sheet)
  • A local logistics product (basis, corridor constraints, processor pull)

That’s why USDA-style supply/demand narratives can be “right” while your delivered price still moves the wrong way.

Also: the U.S. export arena is structurally competitive—Brazil, Argentina, and (when available) Ukraine materially shape global trade flows and price pressure.

4) The Critical Insight: Why Your Delivered Price Disconnects from “Corn Futures”

Most procurement teams over-index on CBOT and under-manage basis.

Delivered price = Futures + Basis + Freight + Handling + Quality adjustments

A stacked bar chart showing a representative delivered corn price broken into CBOT futures, local basis, freight/handling, quality adjustments, and supplier/channel margin, with a formula callout 'Delivered Price = Futures + Basis + Freight/Handling + Quality Adj. + Margin' and annotations noting basis and freight are the most volatile local components.

Why the disconnect happens:

  1. Basis is a local supply/demand signal (processor pull, elevator capacity, farmer selling pace).
  2. Freight is a constraint market (barge drafts, rail service, truck capacity).
  3. Quality events re-route flows (wet harvest → more drying; mycotoxin risk → rejections/diversion).

Example pattern (validated in river disruptions):

  • Futures may reflect global supply, but low river levels constrain barge loading and raise freight → spatial basis relationships change and delivered costs become unstable even without a futures shock. [2]

5) Where Procurement Teams Commonly Misstep (Even When They’re Good Buyers)

  1. Treating corn like a single index-linked buy
  2. Mistake: “We’re covered because we’re hedged on CBOT.”
  3. Reality: You can still blow the budget on basis/freight.
  4. Running RFQs without a should-cost that separates basis and freight
  5. Result: suppliers can hide margin in bundled delivered quotes.
  6. Not segmenting suppliers by corridor risk
  7. Single river system / single rail carrier dependence looks fine—until it doesn’t.
  8. Qualifying alternatives only after a disruption
  9. Operational constraint: QA approvals and trial loads can take weeks; during a disruption you pay peak basis.
  10. Over-optimizing for lowest price and under-paying for service levels
  11. Trade-off: lowest basis today vs. OTIF reliability and quality consistency.

6) What an Intelligence-Driven Approach Changes (Decision → Action → Outcome)

This is not “more data.” It’s converting signals into procurement controls.

A) Price intelligence → Contracting posture

  • Decision: fixed vs formula; which index month; how much coverage to layer.
  • Action: separate commodity vs basis vs freight; set timing bands and triggers.
  • Outcome: improved budget variance control and fewer emergency buys.

B) Should-cost decomposition → Better negotiations

  • Decision: whether a quote is “market” or “supplier margin.”
  • Action: challenge delivered quotes with corridor freight benchmarks and basis norms.
  • Outcome: cleaner savings story (market move vs skill).

C) Supplier benchmarking → Governance that prevents repeat issues

  • Decision: award and allocation rules (dual source, performance gates).
  • Action: scorecards on OTIF, claims, quality, responsiveness.
  • Outcome: fewer repeat incidents and faster corrective actions.

D) Risk monitoring → Earlier mitigation

  • Decision: when to shift lanes, increase coverage, or activate backups.
  • Action: watch disruption signals (river levels, rail congestion, policy shifts) and map exposure by plant.
  • Outcome: reduced disruption impact and lower expediting cost.

7) Strategic Use Cases Procurement Can Run (Practical, Repeatable)

  1. “Basis control tower” for multi-plant buying
  2. Weekly: track basis by corridor + supplier; flag outliers.
  3. Monthly: reset allocation when basis premium exceeds service value.
  4. Layered coverage program (reduce volatility without raising stockout risk)
  5. Define coverage bands (e.g., 60–80% forward) with spot top-ups.
  6. Tie re-openers to basis blowouts and freight indices.
  7. Pre-qualification bench (backup sourcing before disruption)
  8. Maintain 2–3 alternates per plant by spec and lane.
  9. Pre-negotiate minimums, lead times, and quality dispute process.
  10. Ethanol-adjacent demand mapping
  11. Identify plants competing for your bushels; quantify local basis sensitivity.
  12. Use this to decide where you pay for reliability vs where you shop aggressively.
  13. Quality risk playbook (mycotoxin/harvest variability)
  14. Tighten receiving specs only where value is real.
  15. Build diversion options (feed vs ethanol vs other outlets) into contracts.

8) Why This Matters Beyond Corn (Patterns You’ll Reuse in Other Categories)

Corn is a clean example of a broader procurement truth: the price you pay is rarely just the headline commodity index.

Examples procurement leaders typically also buy:

  • Soybean meal / feed ingredients: global futures + local crush margins + freight constraints (very similar basis logic).
  • Wheat / flour: futures may drop while protein premiums and milling spreads rise; quality and spec fragmentation drive real cost.
  • Sugar: global benchmark vs local refining capacity, port constraints, and contract timing.
  • Coffee/cocoa: global price + differentials (quality/origin), logistics and compliance costs can dominate delivered price.

The transferable capability is the same: separate index movement from local differentials, then govern the differential.

9) Why This Corn Example Resonates with Sourcing Leaders

Corn procurement is a high-volume, high-visibility category where you can prove better decision quality quickly.

It’s powerful because:

  • The cost stack is decomposable (futures vs basis vs freight vs quality adjustments).
  • Disruptions are frequent enough (weather/logistics/policy) to justify governance triggers.
  • Cross-functional alignment is measurable:
  • Finance: forecast accuracy, variance to budget
  • Ops: OTIF, stockout incidents, expedites
  • QA: rejection rate, claims closure time

A practical next step you can execute this week:

Build a one-page delivered-cost should-cost template for your top 5 lanes:

  1. CBOT month reference
  2. expected basis range (by origin)
  3. freight benchmark (truck/rail/barge)
  4. handling/inspection
  5. quality premium/discount schedule

Use it to re-score your current suppliers and identify where you’re paying basis/freight margin vs paying for service reliability.

Tridge Eye Data Intelligence Solution

Make Faster, Data-Driven Sourcing Decisions

The insights in this report are just the starting point. Tridge Eye is the data intelligence solution that gives procurement and sourcing leaders real-time market signals, price benchmarks, and supply risk alerts — so you can act before the market moves.

Explore Tridge Eye →

References

  1. ers.usda.gov
  2. farmdocdaily.illinois.edu
Subscribe
By subscribing you agree to with our Privacy Policy and provide consent to receive updates from our company.
Thank you! Your submission has been received!
Oops! Something went wrong while submitting the form.
Subscribe to receive the latest blog posts, updates, promotions, and announcements from Tridge.