
This report is powered by Tridge Eye Data Intelligence.
Every data point, price signal, and supply risk insight in this analysis comes from the same platform that procurement and sourcing leaders worldwide rely on daily. As you read, consider what this level of market intelligence could do for your sourcing decisions.
Cocoa sourcing is often treated like a straightforward ingredient purchase, but it behaves more like a risk-managed supply system: agricultural variability upstream, processing bottlenecks midstream, and tightening compliance/traceability requirements downstream. This guide is written for procurement and sourcing managers who are experienced buyers in other categories but need a practical, cocoa-specific mental model to make defensible allocation and contracting decisions—without assuming perfect price forecasts.
Analyzed at: Mar, 2026
Insight: Treat 2026 contracting as a variance-reduction exercise rather than a “beat the market” exercise: (1) split awards by route + grinding hub (not just supplier names) to reduce correlated disruption exposure; (2) renegotiate contracts to separate index vs basis/differentials vs compliance premiums with explicit caps/tiers; and (3) accelerate pre-qualification of at least one alternate for each critical spec (butter deodorization profile; powder pH/color; micro limits). This typically reduces total landed cost variance (claims, expediting, downtime risk) more reliably than chasing unit price in a volatile market.
Cocoa procurement looks like an “ingredient buy,” but operationally it’s a multi-node agricultural + processing system where value, risk, and compliance obligations accumulate at each handoff.
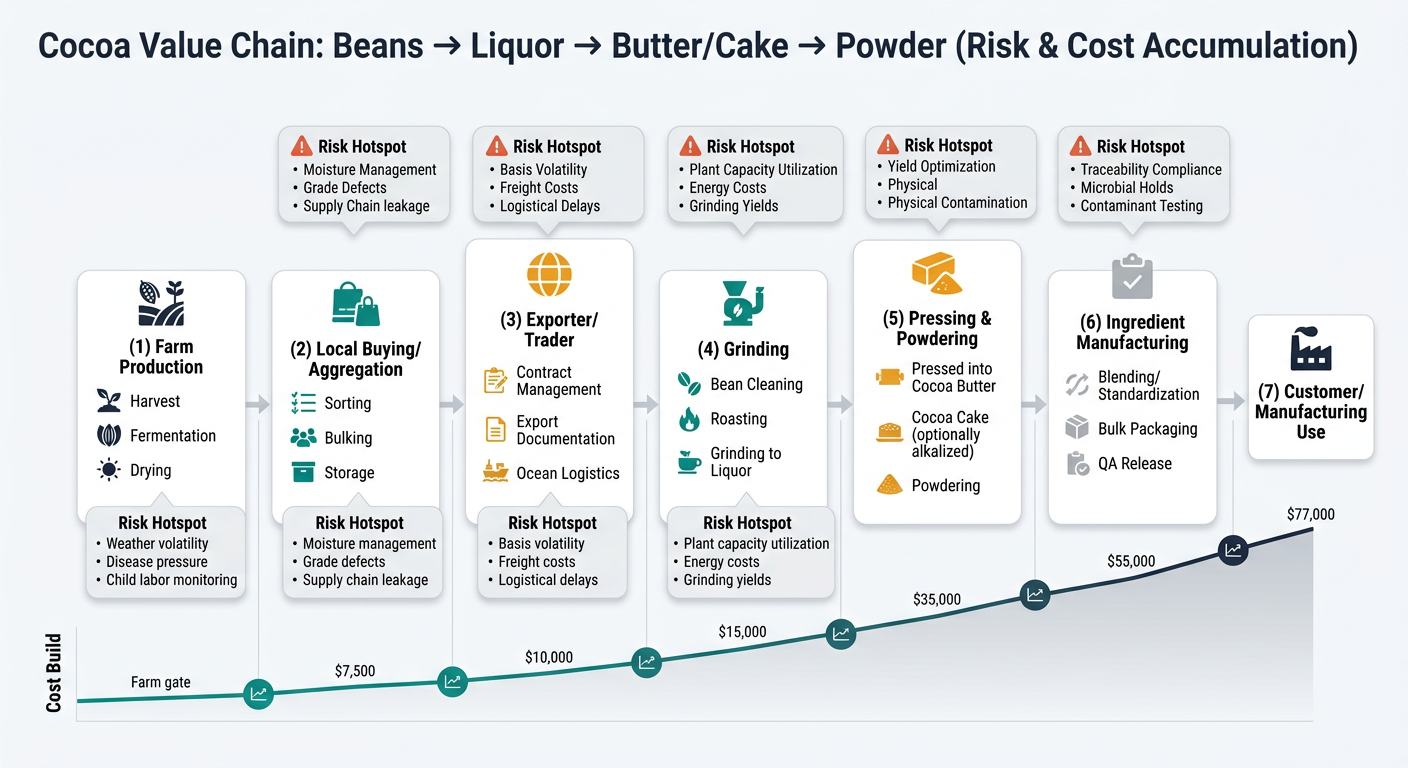
Key insight: Cocoa is an agricultural commodity with high yield uncertainty and quality variability driven by fermentation/drying discipline. That variability directly affects grinder yield and therefore the price you see for liquor/butter/powder.
Key insight: Aggregation is where “hidden” cost shows up as losses and claims: moisture out-of-spec, mold risk, foreign matter, infestation, and inconsistent bean counts.
Key insight: Traders monetize their ability to assemble compliant lots, manage documentation, and carry logistics risk. In tight markets, differentials widen because “deliverable” cocoa becomes scarce.
Key insight: Grinding converts agricultural variability into industrial consistency—but at a cost: energy, maintenance, QA, and yield management.
Reference reality: ICCO grindings data consistently shows the Netherlands and Germany as top grinding locations, with Indonesia and Malaysia also among major grinders. Use this to think about your exposure to specific processing hubs (energy, capacity, congestion) rather than treating “processing” as generic [2].
Key insight: Butter and powder economics are coupled by the butter-to-powder output ratio. If your demand skews heavily to one side (e.g., butter tightness), costs can spike even if beans are stable.
Process reality: Cocoa liquor is pressed to remove butter; powders are produced by pulverizing press cake; alkalization can be applied at different steps depending on the product and plant configuration.
Key insight: Downstream price to your business may not track futures quickly because brands and ingredient manufacturers reprice on cycles, carry inventory, and embed hedging/coverage positions.
Observed market behavior: Multiple reports in 2024–2025 highlighted that cocoa futures spikes did not immediately translate into lower shelf prices when futures later softened (pricing lag and coverage effects).
These are modeled ratios to show where cost concentrates by product form. Actual splits vary by origin, certification/segregation, plant utilization, energy, Incoterms, and market tightness. Use them as a “where to look” guide, not a should-cost guarantee.

| Supply Chain Node | Cost Ratio (% of Delivered Cost) | Notes |
|---|---|---|
| Farming (incl. fermentation/drying labor) | 65% | Dominant driver; yield and quality variability matter most. |
| Local buying/aggregation | 10% | Sorting losses, storage, internal transport, financing. |
| Exporter/trader margin & services | 8% | Assembly, documentation, risk transfer. |
| Packaging & QA | 4% | Bagging, sampling, basic tests. |
| Logistics (freight/insurance/port) | 13% | Highly variable with lane congestion and Incoterms. |
| Supply Chain Node | Cost Ratio (% of Delivered Cost) | Notes |
|---|---|---|
| Bean input value | 55% | Beans still dominate; quality affects yield and flavor. |
| Grinding conversion cost | 18% | Energy, labor, maintenance, losses. |
| QA & food safety release | 6% | Micro testing and spec conformance. |
| Packaging | 6% | Blocks, liners, palletization. |
| Logistics | 7% | Often steadier than beans but still lane-dependent. |
| Processor margin | 8% | Utilization and demand balance matter. |
| Supply Chain Node | Cost Ratio (% of Delivered Cost) | Notes |
|---|---|---|
| Bean input value | 45% | Indirect through liquor; tight bean markets propagate quickly. |
| Grinding + pressing cost | 22% | Press efficiency and energy matter. |
| QA & specification compliance | 7% | Fat profile, odor, contaminants. |
| Packaging/handling | 8% | Blocks/cartons or liquid handling/totes. |
| Logistics | 8% | Temperature/handling requirements can raise risk/cost. |
| Processor margin | 10% | Strongly affected by butter/powder balance. |
| Supply Chain Node | Cost Ratio (% of Delivered Cost) | Notes |
|---|---|---|
| Bean input value | 40% | Indirect via liquor/cake; still the anchor. |
| Grinding + pressing + milling | 25% | Multi-step, energy-intensive. |
| Alkalization (if Dutched) | 6% | Chemical + energy + yield impacts. |
| QA & micro controls | 10% | Release testing and contamination prevention. |
| Packaging | 9% | Multiwall bags, labeling, pallet wrap. |
| Logistics | 5% | Bulkier but stable lanes. |
| Processor margin | 5% | Often squeezed when demand weakens. |
Cocoa is not just “global.” It is concentrated—and concentration creates correlated shocks.
Procurement teams often expect cocoa to behave like metals: futures up → physical up immediately; futures down → physical down immediately. Cocoa often does not.
Market reality example: The 2024–present volatility is widely linked to West African supply tightness after consecutive seasons affected by weather and disease [5]. Treat this as a reminder that “screen price” is only one input into physical procurement timing.
Quality reality anchor: Many industrial guidance sources describe buyer requirements for cocoa bean moisture at approximately ~7% (often expressed as a maximum). Exact targets vary by origin and contract, but moisture remains one of the most practical predictors of mold risk and claims exposure [3].
The objective isn’t “forecast cocoa.” It’s to make defensible allocation and contracting decisions under uncertainty.
Decision impact:
Decision impact:
Decision impact:
Regulatory reality: Many procurement-facing summaries now describe EUDR applicability dates later than the original 2024 expectation, commonly referenced as Dec 30, 2026 for large/medium and Jun 30, 2027 for small/micro enterprises (subject to change; validate against your legal/compliance team and customer requirements) [4].
Intelligence-based sourcing is most valuable in categories with (1) agricultural variability, (2) concentrated origins, (3) rising compliance, (4) processing bottlenecks—cocoa just makes these visible.
Cocoa forces procurement teams to confront the full reality of modern sourcing:

Make Faster, Data-Driven Sourcing Decisions
The insights in this report are just the starting point. Tridge Eye is the data intelligence solution that gives procurement and sourcing leaders real-time market signals, price benchmarks, and supply risk alerts — so you can act before the market moves.


