INDUSTRY TRENDS

Cocoa Paste Procurement (2026 Guide): How to Control Price Volatility Without Breaking Spec or Supply

Author
Team Tridge
DATE
March 20, 2026
10 min read
cocoa-paste Cover
Tridge Eye Data Intelligence Solution

This report is powered by Tridge Eye Data Intelligence.

Every data point, price signal, and supply risk insight in this analysis comes from the same platform that procurement and sourcing leaders worldwide rely on daily. As you read, consider what this level of market intelligence could do for your sourcing decisions.

Explore Tridge Eye →

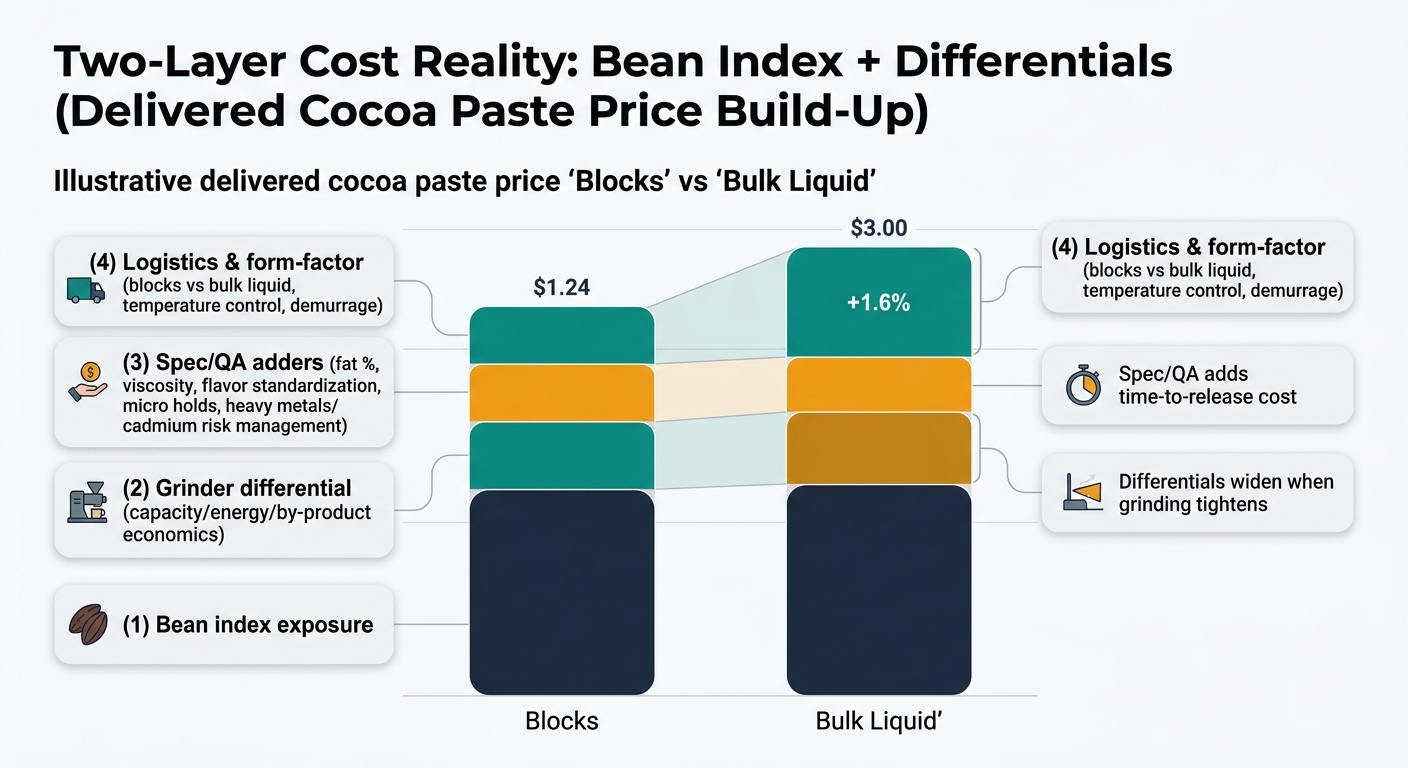
Cocoa paste (cocoa liquor / cocoa mass) sits in the uncomfortable middle of a highly origin-concentrated agricultural supply chain and a capacity-concentrated grinding industry. For procurement leaders, the practical takeaway is simple: your delivered cocoa paste cost and continuity risk are driven by two layers—(1) bean fundamentals and (2) grinding + spec + logistics “differentials.” This guide explains the supply chain in plain terms, shows where cost and risk really move, and translates that into decision-ready sourcing actions (award/renew/dual-source/re-bid/mitigate) without overpromising outcomes.

Executive Summary

  • Two-layer commodity reality: Cocoa paste cost behaves like bean index exposure + grinder differential + spec/QA adders + logistics/form-factor—not “futures + fixed conversion.”
  • Stacked chart illustrating delivered cocoa paste price build-up: bean index exposure, grinder differential, spec/QA adders, and logistics/form-factor, with side-by-side comparison of blocks vs bulk liquid and callouts on widening differentials and time-to-release cost.
  • Origin concentration is real (and procurement-relevant): Côte d’Ivoire is commonly cited around the low-40% range of global cocoa bean output, and West Africa overall is often cited around ~70%+—meaning origin shocks quickly become allocation and differential shocks.
  • Grinding is a pinch point: When grinding capacity/utilization tightens, differentials can widen even if futures are flat, and suppliers with advantaged footprints (energy, location, by-product economics) gain pricing power.
  • Spec is a commercial constraint: Fat %, viscosity/flow behavior, flavor, and contaminant controls (e.g., cadmium risk management by origin/blend) drive blending, holds, and release lead time—often the hidden cost.
  • 2024–2025 price regime changed behaviors: The market saw record-high cocoa futures levels in 2024 (e.g., ~$9,000/mt in March 2024 and higher later), reinforcing the need to negotiate terms (coverage, allocation, index pass-through timing) not just unit price.
  • Governance is becoming “operational,” not just policy: Deforestation/traceability expectations (e.g., EUDR timelines shifting) increase the value of lot structure visibility, documentation discipline, and exception tracking.

Key Insights

(Analyzed at: Mar, 2026)

  • Strategy: Hold
  • Reliability: Medium
  • Potential Saving: 4% ~ 10%
  • Insight: Treat 2026 cocoa paste sourcing as a terms-and-differentials optimization cycle, not a pure price chase. With recent extreme volatility and ongoing traceability/deforestation due diligence ramp-up, the most defensible near-term action is to hold core volumes with incumbents where spec performance is proven, while immediately re-benchmarking the grinding differential, allocation language, and index pass-through mechanics versus 2–3 credible alternates (ideally with a different grinding footprint). This typically unlocks savings through reduced “surprise” adders (expedites, demurrage, ad-hoc QA holds) and tighter differentials—without forcing a rushed spec re-qualification.

1) What you’re actually buying: the cocoa-paste supply chain in plain terms (ground truth)

Cocoa paste (also called cocoa liquor / cocoa mass) is the ground, unsweetened cocoa nib with its natural cocoa butter still inside. It sits in the middle of a supply chain that is origin-concentrated upstream and capacity-concentrated midstream—which is why procurement outcomes are driven as much by where and who grinds as by the bean price.

Typical flow (and where disruptions really happen):

  1. Farm & primary post-harvest (origin): pods harvested → beans fermented (often ~5–7 days, varies by practice) → dried → bagged.
  2. Aggregation & export prep: buying stations/co-ops → grading → warehousing → port.
  3. Grinding / processing (the “pinch point”): cleaning/roasting → cracking/winnowing (nibs) → grinding into paste (liquor) → optional deodorization/standardization/blending.
  4. Form factor & packing: 25 kg blocks/cartons or bulk heated liquid (ISO tanks).
  5. International logistics: containers (blocks) or temperature-controlled lanes (liquid).
  6. Industrial use: chocolate, compound coatings, bakery, dairy, beverages.
Left-to-right cocoa paste supply chain flow diagram with six nodes (farm to industrial use), highlighting grinding as a pinch point and overlaying bean fundamentals vs grinding/spec/logistics differentials, with risk icons for origin shocks, capacity/utilization, QA holds, and logistics delays/temperature control.

Two market realities procurement teams underestimate:

  • Origin concentration: Côte d’Ivoire is widely cited around the low-40% range of global cocoa output, with West Africa overall often cited around ~70%+—so weather/disease/policy disruptions quickly cascade into availability and pricing power downstream.
  • Paste is not “just beans”: between bean price and your delivered paste price sits a grinding margin + capacity constraint + QA/spec risk + logistics form-factor choice (blocks vs liquid). Those variables can dominate supplier-to-supplier spreads even when futures are flat.

2) Where the money goes: cost and margin build-up by node (and what it means in negotiations)

Below is a procurement-oriented view of what cost drivers are “real” at each node, what’s usually negotiable, and what is not.

2.1 Upstream: farming + fermentation/drying (the cost base you can’t “audit away”)

Key insight: Bean cost is the biggest component, but your effective bean cost is shaped by quality losses and compliance holds (defects, moisture, contamination), not just the headline origin price.

What drives cost here

  • Labor-intensive harvesting + fermentation/drying discipline (drives flavor, acidity, defect rate)
  • Yield volatility (weather, disease/pest pressure)
  • Farmgate pricing mechanisms in key origins (policy can decouple local supply response from global futures)

Procurement levers (practical)

  • Tighten incoming quality specs (moisture, defects) but price in the reality of higher rejection risk during tight supply.
  • Build an origin strategy that separates:
  • “must-have” flavor origins (R&D locked)
  • “functional bulk” origins (more substitutable)

2.2 Aggregation/export: the hidden cost of “clean supply”

Key insight: Aggregation adds more than margin—it adds sorting losses, traceability handling, and working-capital cost (especially when the market is volatile).

What drives cost here

  • Grading/sorting and shrink
  • Warehousing, financing, and documentation
  • Segregation for certification/traceability programs

Procurement levers

  • Ask suppliers to show lot structure (how many lots per shipment; how they manage segregated vs mass balance).
  • Negotiate quality claim windows and dispute resolution tied to objective test methods.

2.3 Grinding into cocoa paste: the midstream “price setter” you must model

Key insight: Grinding capacity and the grinder’s economics (energy, yield, by-product balance) create a basis/differential that can swing faster than your internal budgeting cycle.

What drives cost here

  • Energy + maintenance (grinding is power-intensive)
  • Yield management (shell removal efficiency; liquor losses)
  • Blending/standardization to hit viscosity/flavor targets
  • Food safety controls (metal detection, micro holds)

Useful anchor facts for non-specialists

  • Cocoa paste typically contains roughly ~50–55% cocoa butter (fat) (often described as roughly “about half” fat, with variation by process and standardization).
  • A practical yield framing: after roasting/winnowing, clean nib yield is commonly cited around ~70% of bean mass in some protocols, and some training/industry materials cite ~80% cocoa liquor yield from processed beans as an average—use these as planning heuristics, not contractual guarantees.

Procurement levers

  • Separate price into: (A) bean index exposure + (B) grinding differential + (C) logistics/form + (D) QA/traceability adders.
  • Benchmark suppliers on grinding footprint (origin grinding vs EU grinding vs NA grinding) because it changes:
  • lead time and allocation risk
  • traceability chain length
  • logistics mode options

2.4 Packaging + QA: where “cheap” paste becomes expensive

Key insight: QA cost is not the lab test; it’s the time-to-release + rework risk (re-blending, re-routing, holds) when specs are tight.

What drives cost here

  • Sampling plans, retain samples, COAs, and release workflow
  • Packaging choice:
  • Blocks/cartons: simpler logistics, but more handling and potential odor pickup
  • Bulk liquid: fewer handling steps, but temperature-controlled logistics and higher lane constraints

Procurement levers

  • Standardize COA fields (fat %, moisture, viscosity method, micro, heavy metals where relevant) and require method references.

2.5 Logistics + delivery: form-factor is a commercial decision, not only a transport choice

Key insight: Logistics is where continuity fails first: port congestion, container availability, demurrage, and for liquid—temperature control.

What drives cost here

  • Ocean freight + inland drayage
  • Inventory carrying cost (especially when prices swing)
  • Temperature management for liquid shipments

Procurement levers

  • Put Incoterms under scrutiny: who owns delay risk and demurrage?
  • Use dual lanes (e.g., two ports / two forwarders) for critical plants.

2.6 End-market margin: why your supplier’s “can’t move” story is often incomplete

Key insight: Many suppliers manage their own risk via coverage periods, allocation clauses, and credit terms—so negotiation must address terms, not just price.

Procurement levers

  • Negotiate explicit allocation rules, MOQ flexibility, and service-level penalties/credits.

Product-level cost breakdown (illustrative, modeled for procurement planning)

These are illustrative ratios of final delivered cost (DDP-like) to help procurement teams see where cost concentrates. Actuals vary by origin, certification, shipment form, and market tightness.

A) Cocoa Beans (export-grade, bagged)

Supply Chain Node Cost Ratio (% of Delivered Bean Cost) What moves it most
Farming + post-harvest 65% farmgate price policy, yield, quality discipline
Aggregation/export prep 15% sorting losses, financing, traceability segregation
Logistics & insurance 15% freight cycles, port congestion, FX
Trader/exporter margin 5% counterparty risk, liquidity

B) Cocoa Nibs (industrial)

Supply Chain Node Cost Ratio (% of Delivered Nibs Cost) What moves it most
Beans input cost 70% bean index + quality losses
Primary processing (roast/winnow) 12% energy, yield (shell removal)
Packaging & QA 6% micro controls, foreign matter
Logistics 7% container rates
Processor margin 5% utilization, demand

C) Cocoa Paste / Liquor (blocks, industrial)

Supply Chain Node Cost Ratio (% of Delivered Paste Cost) What moves it most
Beans input cost (embedded) 68% futures + differentials, origin availability
Grinding/standardization 14% grinding margin, energy, capacity tightness
Packaging & QA 6% release holds, spec tightness
Logistics 7% freight + inland
Processor margin 5% allocation power, service level

D) Cocoa Paste / Liquor (bulk liquid, heated)

Supply Chain Node Cost Ratio (% of Delivered Paste Cost) What moves it most
Beans input cost (embedded) 66% futures + differentials
Grinding/standardization 14% same as above
Packaging/handling (bulk systems) 7% tank availability, cleaning, handling
Temperature-controlled logistics 9% lane constraints, energy, delays
Processor margin 4% volume commitments

3) One structural fact that should reshape your category strategy

Cocoa paste procurement is a “two-layer commodity”:

  • Layer 1: Bean fundamentals (weather, crop disease, origin policy) drive the global price direction.
  • Layer 2: Grinding economics and capacity drive the spread between suppliers and regions (and determine who gets allocated volume when markets tighten).

This is why two suppliers can quote very different paste prices while both claim “we follow futures.”

Also, the market has demonstrated extreme volatility recently (e.g., NY cocoa futures approaching ~$9,000/mt in March 2024 and later printing higher records in subsequent months), which increases the value of contract structure and risk governance.

4) The critical insight: why cocoa paste prices can disconnect from cocoa futures

Procurement teams often assume: Paste price = futures + fixed conversion. In practice, the conversion is not fixed.

Four common drivers of disconnection:

  1. Grinding margin swings: When grinders are tight (capacity/utilization), differentials expand—even if futures are stable.
  2. Spec complexity: viscosity, flavor profile, deodorization, alkalization (if applicable), and fat % targets increase blending and QA cost.
  3. Compliance-driven blending constraints: Heavy metal risk (notably cadmium) can force origin/blend choices. The EU has maximum cadmium limits for certain cocoa/chocolate categories (thresholds vary by product type and cocoa solids content).
  4. Form-factor logistics: blocks vs bulk liquid changes lane availability, lead time, and demurrage exposure.

Procurement implication: If you don’t explicitly model (and negotiate) the differential drivers, you’ll treat supplier spreads as “noise” and lose leverage.

5) Where procurement teams typically get cocoa paste wrong (patterns we see)

  1. Over-consolidating on one grinder footprint
  2. Looks efficient on price, but creates a single point of failure (allocation, plant outage, port disruption).
  3. Treating QA/spec as a post-award problem
  4. Results in emergency buys when a new supplier fails viscosity/flavor or has longer release holds.
  5. Running RFQs without a contract-structure view
  6. Comparing unit prices while ignoring: coverage period, allocation rules, index pass-through timing, credit terms.
  7. Confusing “traceability claims” with audited compliance
  8. Good intelligence can flag risk and gaps, but it cannot replace audits and documentation review.

6) How an intelligence-driven approach changes the outcome (without overpromising)

Start from the decisions you actually need to make: award / renew / dual-source / re-bid / mitigate. Then apply only the intelligence that changes that decision.

Decision A: Renew incumbent vs re-bid

Use 1–2 capabilities that change the call:

  • Supplier benchmarking: compare incumbent to peers on footprint, lead time, certifications claimed, reliability indicators, and service patterns.
  • Price/driver signals: separate futures-driven movement from grinder-differential movement so you can negotiate the right variable.

Outcome you can measure: reduced price variance versus relevant benchmarks; fewer “surprise” surcharges.

Decision B: Build a dual-source plan that QA can live with

  • Alternative supplier identification: shortlist suppliers that are different by risk driver (different grinding region, different origin mix), not just “another trader.”
  • Qualification sequencing: paper review → lab sample → pilot run → approved backup volumes.

Outcome you can measure: lower single-supplier share; faster recovery time if allocation hits.

Decision C: Mitigate compliance and governance exposure

  • Risk monitoring: origin disruption signals, policy/regulatory shifts, logistics lane instability, counterparty stress signals.
  • Governance outputs: standardized comparison criteria, documented award rationale, exception tracking.

Outcome you can measure: fewer policy exceptions; clearer audit trail for awards.

Hard limits (explicit): intelligence supports decisions, but does not guarantee supply, savings, or compliance; it does not replace QA validation, supplier audits, or contract counsel.

7) Strategic use cases procurement leaders can operationalize in 30–90 days

  1. “Lock vs float” contract design (cost volatility control)
  2. Split price into index + differential; lock differential when capacity is tight; keep index pass-through transparent.
  3. Two-tier supplier portfolio (resilience without chaos)
  4. Primary suppliers for scale + one or two qualified backups with small but real volumes.
  5. Origin-blend strategy aligned to spec risk
  6. Define which SKUs can tolerate origin substitution and which cannot.
  7. Lane and form-factor contingency planning
  8. Pre-approve both blocks and bulk-liquid options if your plants can handle them.
  9. Supplier scorecards that match cocoa reality
  10. Add cocoa-specific KPIs: release lead time, spec drift rate, claim frequency, allocation performance.

8) Why this matters beyond cocoa paste (and where the same playbook applies)

Cocoa paste is a clean example of a broader procurement truth: processed, origin-linked commodities behave differently than raw commodities because midstream capacity and spec constraints amplify risk.

Examples procurement teams sourcing cocoa paste often also touch:

  • Coffee extracts/concentrates: upstream volatility + processing capacity + sensory specs; switching suppliers without reformulation is hard.
  • Fruit concentrates (orange, apple) for beverages: crop shocks + concentration/evaporation capacity + Brix/acid specs; logistics and adulteration controls matter.
  • Dairy powders (skim milk powder, whey): farmgate cycles + drying capacity + functional specs; allocation risk appears in tight markets.

In all three, the winning approach is the same: separate index exposure from conversion margins, qualify alternatives before disruption, and treat QA as part of sourcing—not after it.

9) Why this cocoa paste example is persuasive (for procurement leadership)

Because it forces disciplined procurement behavior under uncertainty:

  • It’s measurable: concentration, lead time, release holds, price variance, allocation performance.
  • It’s decision-linked: award/renew/dual-source choices are visibly better when you model index vs differential.
  • It’s governance-friendly: cocoa’s traceability and contaminant constraints make documentation and rationale non-negotiable.

Inputs I would need to tailor this to your situation (so the analysis becomes decision-ready)

  1. Non-negotiable spec: fat % range, viscosity method/limits, flavor profile, micro limits, heavy metals (if applicable)
  2. Annual volumes + cadence by site; blocks vs bulk-liquid capability
  3. Allowed/restricted origins and required certifications/traceability
  4. Current supplier concentration (top 1/top 3 share) and contract structures (coverage, index linkage, allocation clauses)
Tridge Eye Data Intelligence Solution

Make Faster, Data-Driven Sourcing Decisions

The insights in this report are just the starting point. Tridge Eye is the data intelligence solution that gives procurement and sourcing leaders real-time market signals, price benchmarks, and supply risk alerts — so you can act before the market moves.

Explore Tridge Eye →

Subscribe
By subscribing you agree to with our Privacy Policy and provide consent to receive updates from our company.
Thank you! Your submission has been received!
Oops! Something went wrong while submitting the form.
Subscribe to receive the latest blog posts, updates, promotions, and announcements from Tridge.