INDUSTRY TRENDS

Cocoa Bean Sourcing (2026 Guide): Where Cost, Risk, and Compliance Actually Sit in the Chain

Author
Team Tridge
DATE
March 27, 2026
10 min read
cocoa-bean Cover
Tridge Eye Data Intelligence Solution

This report is powered by Tridge Eye Data Intelligence.

Every data point, price signal, and supply risk insight in this analysis comes from the same platform that procurement and sourcing leaders worldwide rely on daily. As you read, consider what this level of market intelligence could do for your sourcing decisions.

Explore Tridge Eye →

Cocoa looks like a “commodity buy” on paper, but procurement outcomes are driven by a handful of physical and policy choke points: post-harvest processing (fermentation/drying), origin concentration (especially West Africa), logistics dwell time, and the fast-growing compliance burden (notably deforestation due diligence). This guide explains the chain the way it behaves in real buying decisions—so you can structure supplier selection, contracting, and governance around where total cost of ownership (TCO) and disruption risk actually accumulate.

Executive Summary

  • Wet-to-dry conversion matters: A practical wet-bean to dry-bean conversion used in extension guidance is roughly 2.5:1 to 2.7:1 (about 37–40% recovery)—important for availability assumptions and shrink planning.
  • Bag norms are real constraints: Traditional export is typically in ~60–65 kg jute/hessian bags (commonly 62.5 kg net cocoa per bag in some trade conventions), though bulk/mega-bulk is increasingly used.
  • Moisture is a procurement KPI, not a lab detail: Common buyer guidance targets <8% moisture (often ~6–8%) to reduce mold/quality claims risk; contract specs vary by buyer and origin.
  • Origin concentration remains structural: Côte d’Ivoire is widely cited at ~40% of global supply; Côte d’Ivoire + Ghana are often referenced at ~60%+ (varies by year/source).
  • Market tightness has been historically high: ICCO reporting around 2023/24 highlighted very low stocks-to-grindings levels (often cited around the high-20% range, depending on bulletin/season definition).
  • EUDR timing is a moving target: As of late-2025/2026 institutional updates, the application timeline has been postponed, with widely reported dates pointing to 30 Dec 2026 for many operators (and later for smaller operators), but teams should confirm applicability by entity size and role in the chain.

Key Insights

(Analyzed at: Mar, 2026)

  • Strategy: Hold
  • Reliability: Medium
  • Potential Saving: 4% ~ 9%
  • Insight: Treat 2026 as a “basis and compliance execution” year rather than a pure price call. After the extreme 2023/24–2024/25 tightness and subsequent demand softening, procurement risk has shifted toward (1) spec-compliant physical differentials, (2) documentation/traceability capacity, and (3) counterparty execution under working-capital stress. The actionable move is to lock in operational resilience: split negotiations into index vs differential vs compliance surcharge, pre-qualify 2–3 alternates per key origin corridor, and tighten moisture/defect governance to reduce claims and rework costs.

1) The cocoa supply chain, as it actually works (not the org chart)

Most procurement teams think they buy “cocoa beans.” In practice, you are buying a system that starts at smallholder farms and ends at industrial grinders—with multiple conversion steps where quality can be created (or destroyed) and where risk concentrates.

Ground truth flow (physical + commercial)

  1. Farm & harvest (smallholders)
  2. Cocoa is largely produced by smallholders; farms are fragmented upstream, while trade and grinding are more concentrated downstream.
  3. Harvest timing and on-farm practices strongly shape later factory yield and flavor.
  4. Fermentation & drying (often village/co-op level, sometimes on-farm)
  5. This is the quality-making step: fermentation drives flavor precursors; drying stabilizes beans for storage and ocean transit.
  6. Wet-to-dry conversion is material: a practical conversion ratio used in extension guidance is roughly 2.5:1 to 2.7:1 wet beans to dry beans (about 37–40% recovery), which matters for origin availability and shrink assumptions. (Source example: PNG cocoa extension guidance.)
  7. Aggregation / internal trade (collectors, cooperatives, licensed buyers)
  8. Beans are assembled into exportable lots; grading, bagging, and financing occur here.
  9. This is where “paper compliance” and “physical traceability” can diverge.
  10. Export & port logistics (origin warehouses → port → ocean freight)
  11. Cocoa is traditionally shipped in jute/hessian bags (often in the ~60–65 kg range; some trade conventions standardize around 62.5 kg net cocoa per bag), though bulk/mega-bulk shipments are increasingly used.
  12. Quality risk is driven by moisture, condensation, dwell time, and infestation control.
  13. Industrial grinding (beans → liquor, butter, cake/powder)
  14. For many buyers, the real commercial exposure is not just bean price but the pass-through into liquor/butter/powder markets and differentials.
  15. Manufacturing / end markets (chocolate, bakery, dairy, beverages, cosmetics)
  16. End-market demand affects grindings; grindings can fall even when crop is tight, changing physical differentials.
Flowchart of the cocoa supply chain from smallholder farms through fermentation and drying, aggregation, origin warehousing and export, ocean freight and import handling, industrial grinding, and manufacturing/end markets, with overlays highlighting quality creation at fermentation/drying, risk hotspots (origin concentration, port dwell time/condensation, counterparty/working-capital stress), and compliance burden at aggregation/export (traceability, documentation, segregation), plus callouts for wet-to-dry conversion 2.5–2.7:1, moisture target ~6–8%, and typical bag norm ~60–65 kg (example 62.5 kg).

Why this matters for a procurement manager

Cocoa risk is not evenly distributed. It clusters at:

  • Origin concentration (West Africa dominates global supply)
  • Fermentation/drying execution (quality + food safety)
  • Port/logistics dwell time (mold/defects, delays)
  • Governance/traceability (ability to sell into regulated markets)

2) Where cost and margin accumulate—node by node (and why your “bean price” isn’t the whole story)

Key insight: Cocoa is a commodity where value is created early (post-harvest) but monetized later (differentials, rejections, processing yields). That creates a recurring procurement trap: you can negotiate a “good price” and still lose on TCO via quality loss, downtime risk, compliance holds, and working-capital drag.

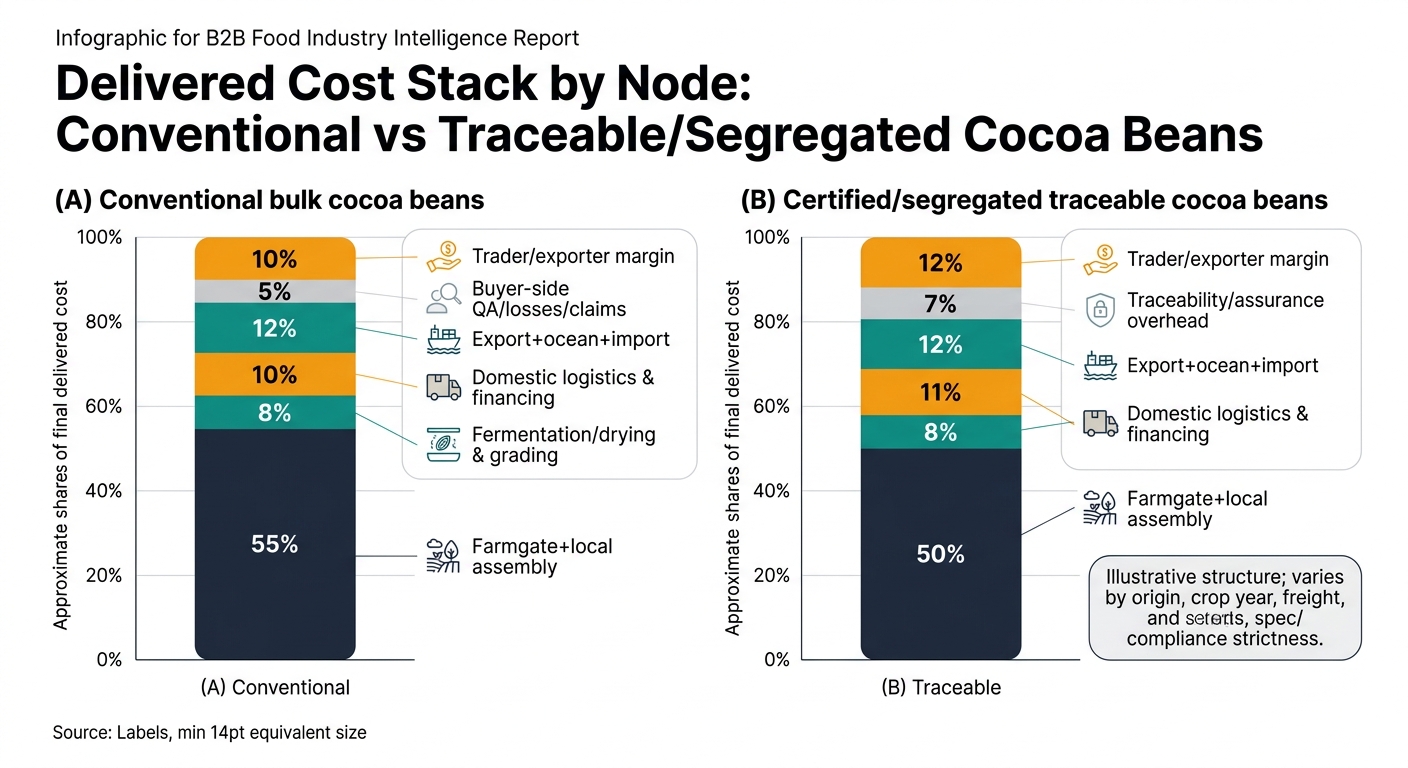
Below is a practical view of cost and margin structure by node. Percentages are illustrative shares of final delivered cost (to a grinder or manufacturer site) and vary by origin, crop year tightness, certifications/segregation, freight, and buyer spec strictness.

2.1 Farmgate economics (pods → wet beans → dried beans)

  • What procurement should know (non-obvious):
  • A meaningful portion of “cost” here is not cash inputs but labor and yield risk.
  • Farmgate price mechanisms (especially in regulated markets) can create smuggling incentives and availability distortions.
  • Primary cost drivers
  • Labor for harvest/pod breaking
  • Inputs (fertilizer/pest control) and rehabilitation
  • Yield variability (weather, disease)
  • Where margin sits
  • Typically thin at farm level; volatility is often absorbed via reduced maintenance, which later shows up as lower yields/quality.

2.2 Primary processing (fermentation + drying + initial grading)

  • What procurement should know:
  • This node determines a large share of flavor profile, defect rate, and storage stability.
  • Moisture management is critical; many buyer/exporter guidance documents commonly reference <8% moisture (often ~6–8%) to reduce mold risk in storage/shipping—your contract spec should be the governing requirement.
  • Primary cost drivers
  • Labor and infrastructure (boxes, mats, dryers)
  • Sorting, defect removal
  • Losses from over/under-fermentation and rejections
  • Where margin sits
  • A lot of “margin” is hidden as quality differential (premium/discount) rather than a visible processing fee.

2.3 Aggregation & domestic logistics (co-ops, collectors, LBCs)

  • What procurement should know:
  • This node is where lot integrity is won or lost (mixing, bag identity, documentation alignment).
  • Working capital is a real constraint; when credit tightens, execution risk rises.
  • Primary cost drivers
  • Internal transport, warehousing
  • Financing/interest
  • Bagging materials and handling
  • Quality claims management (disputes, downgrades)
  • Where margin sits
  • Handling margin + financing spread; can expand sharply during tight markets.

2.4 Export, ocean freight, and import handling

  • What procurement should know:
  • Cocoa is “dry cargo,” but quality is highly sensitive to humidity/condensation and port dwell time.
  • Documentation burden rises with deforestation/traceability rules.
  • Primary cost drivers
  • Port charges, stuffing, fumigation/infestation control
  • Ocean freight + insurance
  • Demurrage/detention risk
  • Compliance documentation and segregation
  • Where margin sits
  • Logistics providers + exporters capture margin; delays can create implicit cost via quality deterioration.

2.5 Grinding / secondary processing (beans → liquor, butter, powder)

  • What procurement should know:
  • Your effective cost exposure depends on your buying form:
  • Beans: more exposure to origin execution and logistics quality risk
  • Liquor/butter/powder: more exposure to processing margins, energy, and plant utilization
  • Primary cost drivers
  • Energy (roasting, grinding, pressing)
  • Yield losses and QA testing
  • Food safety and traceability systems
  • Where margin sits
  • Processing margin can compress or expand rapidly with bean availability and demand for butter vs powder.

2.6 Manufacturing / brand supply chain

  • What procurement should know:
  • Many companies discover too late that “compliance-ready cocoa” is a capacity-constrained product, not a label.
  • Segregation can add cost and lead time.
  • Primary cost drivers
  • Formulation and quality consistency costs
  • Packaging and distribution
  • Retailer pricing cycles (pass-through lag)

Product-level cost breakdown (illustrative)

Modeled as approximate % of final delivered cost to a buyer site. Use as a structure, not a quote.

A) Conventional bulk cocoa beans (West Africa, standard spec)

Supply chain node Cost ratio (% of final delivered cost) What moves it most
Farmgate + local assembly 55% Origin policy, crop size, farmgate pricing, availability
Fermentation/drying & grading 8% Quality execution, defect rate, moisture control
Domestic logistics & financing 10% Credit conditions, inland transport, warehousing
Export + ocean freight + import handling 12% Freight, port dwell time, demurrage risk
Buyer-side QA, losses, claims 5% Rejections, downgrades, cleaning/sorting
Trader/exporter margin 10% Market tightness, counterparty risk

B) Certified / segregated traceable cocoa beans (e.g., deforestation-ready supply)

Supply chain node Cost ratio (% of final delivered cost) What moves it most
Farmgate + local assembly 50% Premium sharing, farmer enrollment, availability
Fermentation/drying & grading 8% Same as conventional; plus stricter lot discipline
Domestic logistics & financing 11% Segregation, identity preservation, audits
Export + ocean freight + import handling 12% Documentation burden, shipment holds
Traceability/assurance overhead 7% Mapping, due diligence statements, audit costs
Trader/exporter margin 12% Limited compliant supply, execution risk premium
Two side-by-side 100% stacked bars comparing illustrative shares of final delivered cost by node for conventional bulk cocoa beans versus certified/segregated traceable cocoa beans, using the article’s node percentages, with a legend and a callout noting the structure is illustrative and varies by origin, crop year, freight, and spec/compliance strictness.

C) Cocoa liquor (delivered to manufacturer)

Supply chain node Cost ratio (% of final delivered cost) What moves it most
Beans input (embedded) 55% Bean market + differentials
Grinding/processing conversion 18% Energy, yield, plant utilization
Packaging & QA 7% Testing, traceability, food safety
Logistics (often temperature-managed depending on form) 10% Freight, handling, lead time
Processor margin 10% Processing spreads, demand for liquor

D) Cocoa butter (delivered to manufacturer)

Supply chain node Cost ratio (% of final delivered cost) What moves it most
Beans input (embedded) 50% Bean market + butter ratio economics
Processing conversion 20% Pressing yields, energy
Packaging & QA 8% Blocks/cartons, testing
Logistics 10% Storage/handling, sometimes temperature sensitivity
Processor margin 12% Butter demand cycles, cosmetics vs food pull

E) Cocoa powder (delivered to manufacturer)

Supply chain node Cost ratio (% of final delivered cost) What moves it most
Beans input (embedded) 45% Bean market + cake availability
Processing conversion 20% Milling, alkalization (if Dutched), energy
Packaging & QA 8% Bags, testing
Logistics 12% Bulk density, freight
Processor margin 15% Powder demand, competition, capacity

3) One structural fact you should build your strategy around: cocoa is concentrated—and that concentration is policy-sensitive

Key insight: Procurement strategy in cocoa is fundamentally a portfolio problem because supply is geographically concentrated, and the most important origins have policy mechanisms that shape availability and pricing behavior.

  • Côte d’Ivoire is widely cited as supplying about 40% of global cocoa (varies by year). (Example: IMF country reporting.)
  • Ghana and Côte d’Ivoire together are often referenced as responsible for around ~60% to ~70% of global supply depending on season and source.
  • Tightness can become extreme; ICCO reporting around 2023/24 highlighted stocks-to-grindings ratios in the high-20% range (often described as multi-decade lows, depending on the bulletin and season definition).

Procurement implication

  • If your approved supply base is effectively “West Africa only,” your risk is not diversified—even if you have multiple suppliers—because the same systemic shocks (weather, disease, port disruption, policy changes) hit them simultaneously.

4) The critical insight: why bean futures, physical differentials, and your delivered cost often diverge

Key insight: Cocoa procurement mistakes often come from anchoring on a single price reference (e.g., futures) while ignoring the basis stack that drives delivered cost.

Three layers that disconnect

  1. Futures price ≠ physical availability
  2. Futures can move on sentiment, positioning, and macro factors.
  3. Physical differentials widen when deliverable quality tightens
  4. When fermentation/drying quality deteriorates or rejections rise, the market can show “enough cocoa” on paper but not enough spec-compliant cocoa.
  5. Compliance-ready cocoa behaves like a constrained specialty product
  6. With deforestation/traceability rules, supply that can carry the right evidence can trade at a premium and/or face fewer shipment interruptions.

Why this got sharper recently

  • ICCO updates across 2023/24 and 2024/25 discussed major balance swings (large deficit followed by partial recovery) while underscoring that global stocks remained fragile relative to grindings.

5) How procurement teams typically get cocoa wrong (even when they’re strong in other categories)

  1. Treating “supplier diversification” as a count of suppliers, not a diversification of origin risks
  2. Five suppliers sourcing the same corridor can behave like one.
  3. Over-optimizing for headline price and under-weighting quality loss and claims
  4. A small increase in defect rate can translate into real cost via downgrades, rework, or production variability.
  5. Assuming certifications/traceability are “paperwork” rather than a capacity constraint
  6. Segregation, mapping, and due diligence can become the limiting factor, not bean availability.
  7. Using annual reviews for a market that changes intra-quarter
  8. Cocoa can move fast; governance cycles often lag the market.
  9. Not pre-qualifying alternates before disruption
  10. Switching late forces you into spot buying, weaker leverage, and higher quality/compliance risk.

6) What an intelligence-driven approach changes (practically) in supplier selection, contracting, and governance

Key insight: Intelligence doesn’t “predict cocoa prices” or “guarantee supply.” It reduces time-to-decision and improves decision quality by separating:

  • market movement vs supplier behavior
  • systemic origin risk vs idiosyncratic supplier execution risk
  • compliant supply vs nominal supply

Capability 1: Supplier discovery & market mapping (decision-led)

Supports decisions like:

  • Origin strategy: How much volume should sit in West Africa vs Latin America vs Asia for resilience?
  • Supplier longlist: Who can actually ship your spec (moisture/defects), your certifications, and your documentation requirements?

Practical outputs:

  • Supplier universe by origin + route-to-market (co-op, exporter, trader)
  • Segregation capability notes (identity preservation, mapping coverage)

Capability 2: Supplier benchmarking & qualification support

Supports decisions like:

  • Who to trial next quarter vs who to keep as “backup only”
  • Which suppliers deserve longer contract coverage because their execution risk is lower

Practical outputs:

  • Scorecards combining: shipment reliability proxies, quality positioning, certification status, and counterparty signals

Capability 3: Risk monitoring (origin/supplier/logistics)

Supports decisions like:

  • Triggering contingency actions before the market tightens
  • Escalating to QA/sustainability early when documentation risk rises

Practical outputs:

  • Watchlists by origin corridor
  • Early-signal alerts (weather anomalies, port disruption chatter, policy changes)

7) Strategic use cases procurement leaders can run in 60–90 days (without reorganizing the company)

  1. Risk-adjusted supplier portfolio redesign (annual strategy + quarterly refresh)
  2. Set explicit thresholds: e.g., max % of volume from one origin, max % from one route-to-market.
  3. Pre-qualification of alternates (resilience playbook)
  4. Maintain a “ready bench” of suppliers by spec fit and compliance readiness.
  5. Contracting policy upgrade: indexation + differential governance
  6. Separate negotiation lanes:
  7. futures/index component
  8. physical differential component
  9. compliance/segregation surcharge component
  10. Quality-to-cost linkage (QA + procurement joint KPI)
  11. Track: rejection rate, downgrade rate, moisture/defect trends, claims cycle time.
  12. Audit-ready sourcing governance
  13. Document exceptions (why you bought outside preferred origin/supplier tier) with risk and cost rationale.

8) Why this approach matters beyond cocoa (examples from adjacent categories you likely buy)

Cocoa is a clear example of how physical realities + policy + quality conversion drive cost and risk. The same intelligence discipline transfers to other procurement categories that share the same pattern:

  • Coffee (arabica/robusta)
  • Similar: origin concentration, weather sensitivity, differentials by quality, and increasing due diligence expectations.
  • Palm oil and derivatives
  • Similar: deforestation-linked compliance exposure; segregated supply behaves differently from conventional.
  • Nuts (cashew, almonds)
  • Similar: quality grading drives yield; logistics and moisture damage can destroy value after purchase.
  • Spices (vanilla, pepper)
  • Similar: fragmented upstream, high fraud/quality variance risk, and compliance/traceability premiums.

Procurement implication

Once you build a repeatable intelligence routine (market mapping → benchmark → monitor → govern), you can replicate it across categories where “cheapest quote” is not the same as “lowest total cost and lowest disruption risk.”

9) Why cocoa is the strongest proof-point for intelligence-led procurement

Cocoa is unusually effective at revealing whether a procurement organization is managing cost, risk, and governance as one system because:

  • Concentration is real and measurable (systemic shocks are common).
  • Quality is created upstream but paid for downstream (differentials, rejections, yield).
  • Compliance is becoming operational, not theoretical.
  • The EU Deforestation Regulation (EUDR) covers cocoa and has driven concrete implementation timelines and documentation expectations; EU institutions have also communicated postponements and differentiated application dates by operator type/size.

If your team can run cocoa well—risk-adjusted portfolio, differential governance, pre-qualified alternates, and audit-ready traceability—you can usually run other agri-commodities better too.

Tridge Eye Data Intelligence Solution

Make Faster, Data-Driven Sourcing Decisions

The insights in this report are just the starting point. Tridge Eye is the data intelligence solution that gives procurement and sourcing leaders real-time market signals, price benchmarks, and supply risk alerts — so you can act before the market moves.

Explore Tridge Eye →

Subscribe
By subscribing you agree to with our Privacy Policy and provide consent to receive updates from our company.
Thank you! Your submission has been received!
Oops! Something went wrong while submitting the form.
Subscribe to receive the latest blog posts, updates, promotions, and announcements from Tridge.