INDUSTRY TRENDS

Cashew Sourcing Intelligence for Ops Leaders: Prevent Downtime in a Two-Step, Yield-Driven Supply Chain

Author
Team Tridge
DATE
March 13, 2026
9 min read
Cashew Nuts Cover
Tridge Eye Data Intelligence Solution

This report is powered by Tridge Eye Data Intelligence.

Every data point, price signal, and supply risk insight in this analysis comes from the same platform that procurement and sourcing leaders worldwide rely on daily. As you read, consider what this level of market intelligence could do for your sourcing decisions.

Explore Tridge Eye →

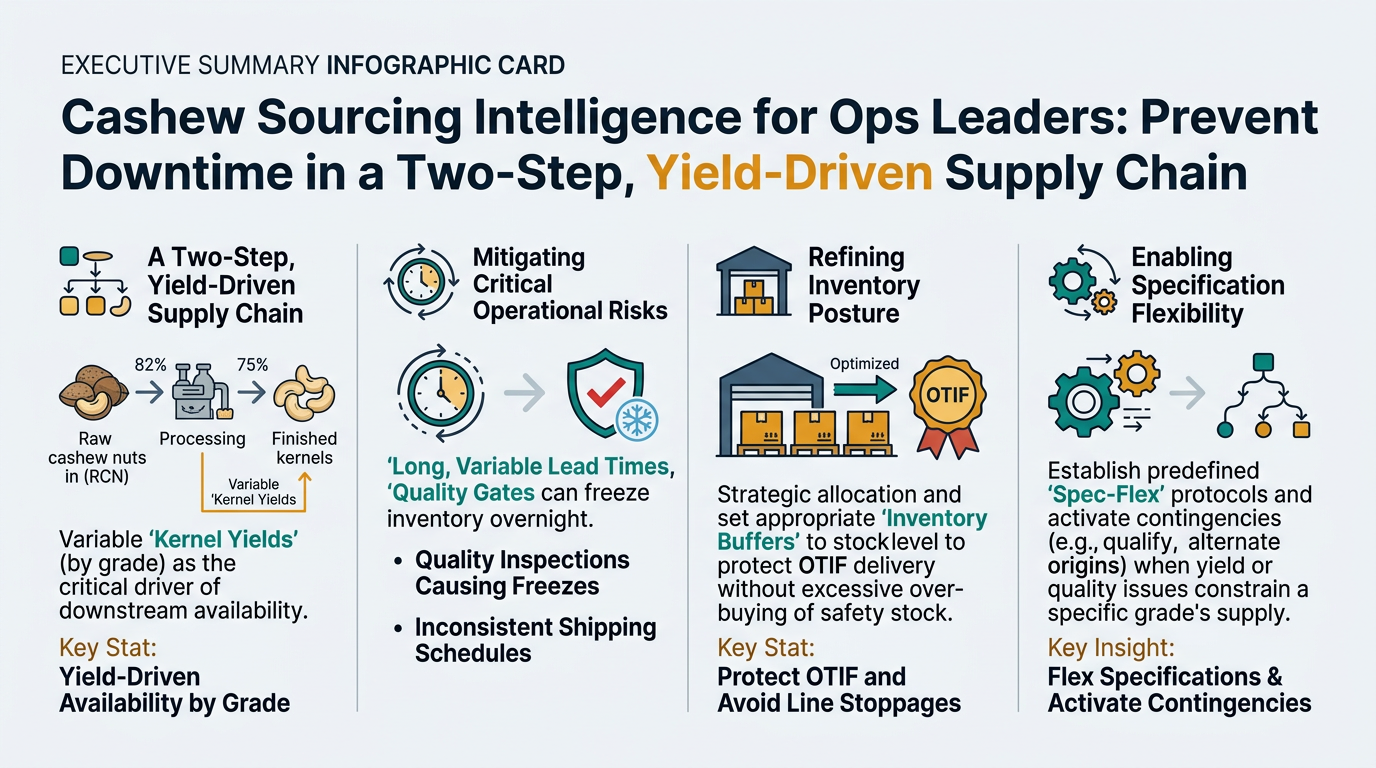
Cashews look like a straightforward “nut ingredient” until you run it like an ops problem: long, variable lead times; yield-driven availability by grade; and quality gates that can freeze inventory overnight. This guide translates cashew market structure into the decisions supply chain and operations leaders actually make—allocation, inventory posture, spec-flex, and contingency activation—so you can protect OTIF and avoid line stoppages without over-buying safety stock.

Executive Summary

  • Two-step chain is the norm: Raw cashew nuts in shell (RCN) are produced largely in tropical origins (notably West Africa), then shipped to processing hubs (especially Vietnam and India) for shelling/grading into kernels. [1]
  • Trading unit + yield language matters: RCN is commonly traded in 80 kg bags, and “outturn/KOR” is commonly expressed as lbs of kernel per 80 kg bag—a direct proxy for yield and value. [2]
  • Grade definitions are standardized enough to operationalize: Whole grades like W180/W240/W320 map to maximum kernels per pound / kg (size), which directly impacts substitution feasibility and cost-to-serve. [3]
  • Processing is a real bottleneck: Shelling/peeling is labor- and safety-constrained due to caustic CNSL in shells; capacity is not “instantly expandable,” and throughput vs breakage is a structural trade-off. [4]
  • Quality events are not theoretical: Nut recalls (including cashews) for pathogens can trigger quality holds, requalification work, and sudden supply disruption. [5]
  • Ops implication: Many “supplier delays” start upstream (RCN buying, processing queues, lane reliability). Intelligence is most valuable when it changes decisions weeks earlier (buffers, allocations, spec-flex approvals, alternate activation).

Key Insights

(Analyzed at: Mar, 2026)

Cashew Nuts Infographic
  • Strategy: Hold
  • Reliability: Medium
  • Potential Saving: 4% ~ 9%
  • Insight: Treat the next 1–2 buying cycles as a risk-management window, not a pure price-play. The cashew chain remains structurally exposed to (1) RCN yield/outturn variability (priced in via KOR, lbs per 80 kg bag) and (2) processing concentration in Vietnam/India (where margin stress can translate into allocation and lead-time slip). Maintain contract coverage for your “must-run” grades, but actively execute spec-flex pre-approvals (W240↔W320 and pieces where formulation allows) and dual-source across non-overlapping dependencies (origin + processor + lane) to reduce expedite and downtime risk. [2]

1) What You’re Actually Buying: The Cashew Supply Chain in Plain Terms (Ground Truth)

Cashew is not a “single-country-to-your-plant” commodity. It’s typically a two-step global chain:

  1. Raw cashew nuts in shell (RCN) are harvested and dried in tropical origins (increasingly West Africa, led by Côte d’Ivoire). RCN is commonly traded in 80 kg bags, and quality is discussed as “outturn/KOR” (often expressed as lbs of kernel per 80 kg bag). [2]
  2. RCN is shipped to major processing hubs (especially Viet Nam and India) where it’s conditioned, shelled, peeled, graded, and vacuum packed into kernels (W320, W240, W180, pieces, splits, etc.). [1]
  3. Kernels then move to importers/roasters/packers and finally to your manufacturing lines (snacks, confectionery, inclusions, nut butters).
A clean, ops-oriented flow diagram showing the typical two-step cashew chain: (1) RCN production/aggregation in tropical origins (highlight West Africa; call out Côte d’Ivoire as a major origin) → (2) ocean shipment to processing hubs (highlight Vietnam and India) where conditioning/shelling/peeling/grading occur → (3) export of kernels to importers/roasters/packers → (4) delivery to manufacturer. Include callouts for the four continuity risk nodes: origin harvest variability, processor throughput/breakage trade-off, ocean lane reliability/port dwell, and inbound QA release/holds. Add a small inset defining trading language: '80 kg bag' and 'Outturn/KOR = lbs kernel per 80 kg bag' as yield proxy.

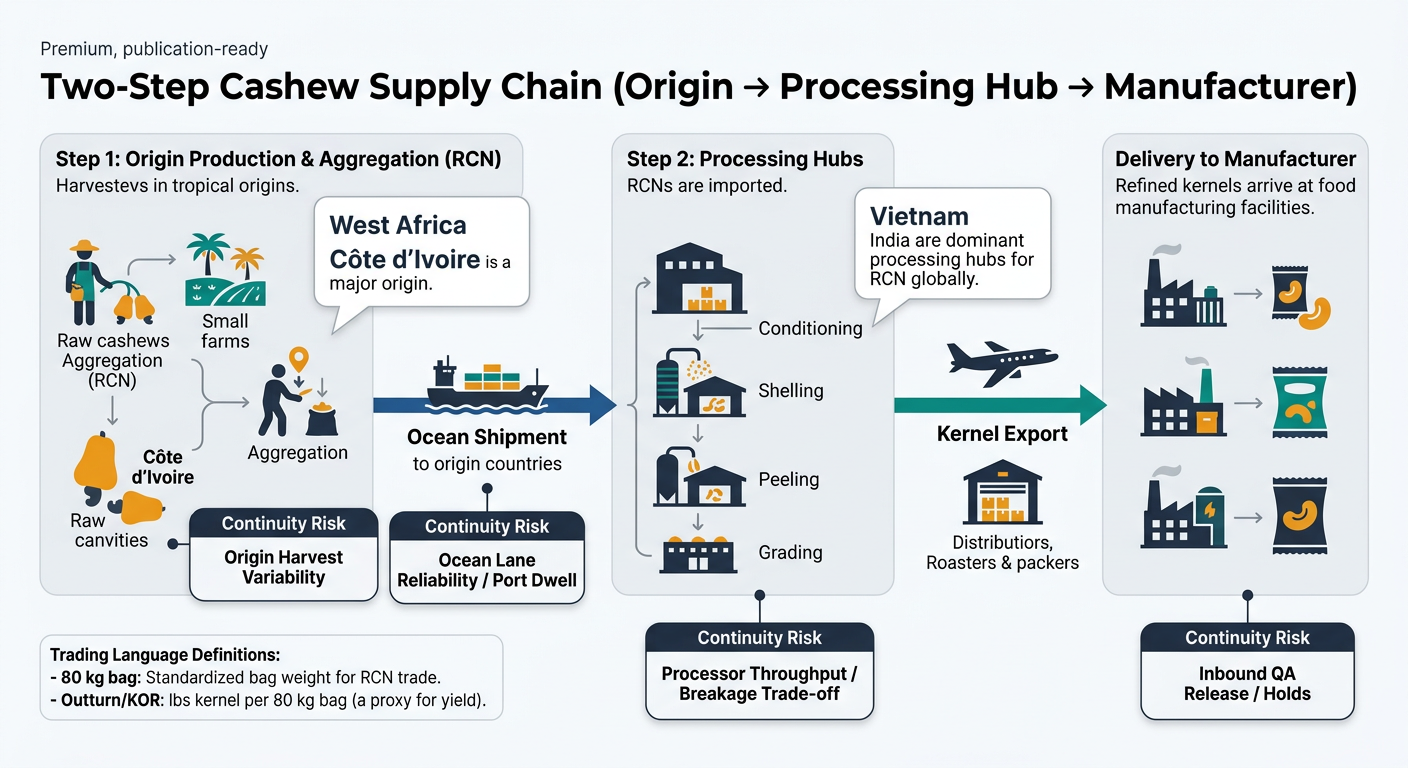
Operational implication: your continuity risk is correlated across multiple nodes—origin harvest + processor throughput + ocean lanes + inbound QA acceptance. A “supplier delay” often starts upstream (RCN procurement and processing queues), not at the moment your PO is confirmed.

2) Where the Money Really Goes: Cost & Margin by Node (and Why Ops Feels It)

Key insight

Cashew cost accumulates in discrete jumps at the points where (a) yield is determined (RCN outturn/KOR), (b) whole-kernel value is protected or destroyed (breakage during peeling/grading), and (c) quality risk becomes binary (micro controls, moisture/rancidity protection via barrier/vacuum or MAP packing).

Below is the cost-and-margin logic iterated by node, using the way cashews are traded and processed.

2.1 Upstream Node: Raw Cashew Nuts in Shell (RCN)

What ops should know

  • RCN is where yield risk is “baked in.” Outturn/KOR is commonly referenced as lbs of kernel per 80 kg bag (e.g., “Outturn 48” ≈ 48 lbs kernel per 80 kg bag). [2]
  • Small shifts in outturn translate into big processor economics (and later, kernel availability/price).

Primary cost drivers

  • Farmgate RCN price (seasonal, harvest-driven)
  • Drying/handling losses (moisture/mold defects)
  • Inland logistics + aggregation margins
  • Financing cost (RCN buying is working-capital heavy)

Where margin sits

  • Aggregators/traders capture margin by assembling volume and managing quality sorting and cash flow.

2.2 Primary Processing Node: Conditioning → Shelling (CNSL risk) → Drying → Peeling

What ops should know

  • Processing is labor- and skill-intensive, and the shell contains caustic cashew nut shell liquid (CNSL)—a safety and yield-critical constraint that limits “instant capacity expansion.” [4]
  • Shelling and peeling settings are a breakage trade-off: higher throughput can destroy whole-kernel recovery (shifting value from wholes to pieces).

Primary cost drivers

  • Labor (shelling/peeling/grading)
  • Energy (conditioning/steam or roasting, drying)
  • Yield losses (breakage, scorched kernels, peel losses)
  • Compliance and H&S controls due to CNSL exposure

Where margin sits

  • Processors’ margin is highly sensitive to (1) RCN outturn and (2) the spread between RCN cost and kernel selling prices.

2.3 Secondary Processing Node: Grading, Roasting (optional), Blending, Ingredient Formats

What ops should know

  • Grading is the value-creation step. Whole grades (e.g., W180/W240/W320) carry premiums; pieces serve industrial/bakery demand and can be used to manage breakage economics.
  • Common commercial grades include W180 (premium large), W240, W320 (high-volume mainstream); the number relates to a size/count convention (kernels per pound / kg thresholds). [3]

Primary cost drivers

  • Sorting/grading labor + QC
  • Roasting/seasoning inputs (if applicable)
  • Rework/scrap management (defects, color, moisture)

Where margin sits

  • Margin is maximized by protecting whole recovery and matching grade mix to demand (retail snack vs industrial).

2.4 Packaging & QA Node: Vacuum/Barrier Packing + Food Safety Release

What ops should know

  • Cashews are not typically cold-chain, but they are quality-fragile: oxygen/moisture control reduces oxidation/rancidity risk; high-barrier packaging and controlled atmospheres are commonly used to protect quality over long transport and storage. [6]
  • Food safety events (e.g., Salmonella-related recalls) can create sudden “quality holds” and requalification work upstream and downstream. [5]

Primary cost drivers

  • Barrier materials, vacuum/MAP/inert gas packing
  • Lab testing (micro, moisture, contaminants per customer spec)
  • Certifications/audits (BRCGS/FSSC 22000, social compliance, traceability)

Where margin sits

  • Packaging/QA is often a smaller % of total cost than raw material, but it is a high-leverage node operationally because it gates shipment release.

2.5 Logistics & Distribution Node: Export Docs → Containers → Import Clearance → Warehousing

What ops should know

  • Cashew lead times are a compound of: origin collection + processing queue + vessel schedules + port dwell.
  • Lane reliability can change quickly; when it does, ops feels it as schedule instability and buffer stock pressure.

Primary cost drivers

  • Ocean freight + insurance + demurrage/detention
  • Working capital during transit
  • Duties/clearance and domestic distribution

2.6 End-Market Node: Importer/Roaster/Packer → Manufacturer → Retail/Foodservice

What ops should know

  • Your “true cost” isn’t just kernel price—it’s cost-to-serve: rejects, rework, expediting, line changeovers, and service penalties.

Product-level cost breakdown (illustrative, ops-focused)

Modeled percentages show share of final delivered cost into a U.S./EU manufacturing site. Actual ratios vary by grade (W180 vs W320 vs pieces), contract structure, freight, and market tightness.

A 3-bar stacked chart (one bar each for: A) RCN delivered to processor, B) W320 kernels delivered to manufacturer, C) pieces delivered to manufacturer). Each bar is segmented by the same nodes to make comparisons easy: Upstream RCN farming/aggregation, Primary processing, Secondary processing, Packaging & QA, Logistics & distribution, Exporter/Importer margin. Use the exact illustrative percentages from the tables (A: 70/0/0/2/18/10; B: 45/20/10/7/10/8; C: 48/18/6/6/12/10). Add a note that values are illustrative and vary by grade, freight, and contract structure. Keep styling editorial (no product UI elements).

A) Raw Cashew Nuts in Shell (RCN) delivered to a processor (Asia/Africa)

Supply Chain Node Cost Ratio (% of Final Cost) Notes
Upstream RCN farming/aggregation 70% Farmgate + aggregation dominates.
Primary processing 0% Not yet processed.
Secondary processing 0% N/A
Packaging & QA 2% Basic bagging/handling.
Logistics & distribution 18% Inland + ocean to processor hub.
Trader/processor margin 10% Financing + risk premium.

B) Cashew Kernels W320 (bulk, vacuum packed) delivered to manufacturer

Supply Chain Node Cost Ratio (% of Final Cost) Notes
Upstream RCN farming/aggregation 45% Embedded via RCN input cost and outturn.
Primary processing (shelling/peeling) 20% Labor/energy/yield losses.
Secondary processing (grading) 10% Protects whole recovery and spec compliance.
Packaging & QA 7% Vacuum/barrier + testing + release.
Logistics & distribution 10% Containers, import, warehousing.
Exporter/importer margin 8% Commercial + risk + financing.

C) Cashew Pieces (industrial grade) delivered to manufacturer

Supply Chain Node Cost Ratio (% of Final Cost) Notes
Upstream RCN farming/aggregation 48% RCN still dominates economics.
Primary processing 18% Similar steps, but value recovery differs.
Secondary processing (grading) 6% Less premium sorting than whole grades.
Packaging & QA 6% Still quality-gated.
Logistics & distribution 12% Similar lanes; sometimes more spot buying.
Exporter/importer margin 10% Higher variability/spot dynamics.

3) The Structural Fact Ops Must Internalize: “Origin ≠ Processor ≠ Your Supplier”

Three structural realities drive most surprises:

  • Origin concentration in raw supply: Côte d’Ivoire is widely cited as a leading RCN producer, and West Africa supplies a large share of global RCN. [7]
  • Processing concentration: Industry sources commonly note that India and Vietnam account for the majority of global cashew processing, with Vietnam heavily reliant on imported RCN. [7]
  • Yield is not stable: Outturn variability (and whole-kernel recovery) changes the effective supply of the grades you actually run on your lines.

Ops takeaway: dual-sourcing “two suppliers” that both depend on the same origin and same processing hub is not real redundancy.

4) The Critical Insight: Why RCN and Kernel Prices Can Disconnect (and Break Your Plan)

In cashews, price is transmitted through a processor margin that can get squeezed or expand quickly.

Common disconnect pattern

  1. RCN prices rise fast during harvest buying (tight crop, financing constraints, auction dynamics).
  2. Kernel prices may lag because buyers resist increases or demand is soft.
  3. Processors get margin-squeezed and respond by:
  4. slowing throughput,
  5. prioritizing contract customers,
  6. pushing different grade mixes,
  7. or delaying shipments while renegotiating.

What ops experiences downstream

  • Longer confirmed lead times
  • More partial shipments and allocation behavior
  • More grade substitutions (W320 vs W240 availability) and higher breakage/pieces offers

Why intelligence matters here: you’re not forecasting “a price,” you’re forecasting behavior under margin stress.

5) Where Procurement/Ops Teams Commonly Misstep (Even When They’re Good at Other Categories)

  1. Treating cashew like a single-node buy (quote → PO → delivery) instead of a multi-node chain with yield and processing constraints.
  2. Over-indexing on unit price and under-modeling:
  3. inbound defect/hold probability,
  4. lead time variability,
  5. expedite likelihood,
  6. and the cost of schedule changes.
  7. Assuming “backup supplier” equals resilience without checking shared dependencies (same processor group, same origin RCN, same port/lane).
  8. Static inventory rules (e.g., “6 weeks cover”) that ignore lane-specific variability and correlated disruption risk.
  9. Grade/spec rigidity without a spec-flex playbook (e.g., when W240 tightens, no pre-approved shift to W320/pieces for certain SKUs).

6) What an Intelligence-Driven Approach Changes: Earlier Decisions, Not Just Better Explanations

This is decision support—not a promise of price or supply. The point is to move from reactive expediting to triggered, pre-planned actions.

A) Supplier discovery & benchmarking → changes allocation decisions

  • Build a bench by grade/spec (W320, W240, pieces) and by risk profile:
  • certifications and audit readiness,
  • capacity/throughput signals,
  • historical quality proxies (claims, holds),
  • lead time variability by lane.

Ops outputs

  • “Primary/secondary” allocation map by SKU family
  • Conditional approvals (what QA needs to clear before a disruption)

B) Price + market intelligence → changes timing and contracting posture

  • Track:
  • spot vs contract deltas,
  • RCN availability and outturn signals,
  • freight/route reliability,
  • FX exposure by payment currency.

Ops outputs

  • Risk-adjusted landed cost comparisons (not just FOB)
  • Contracting guidance: when to lock vs when to stay flexible

C) Risk monitoring → changes inventory posture and expedite spend

  • Monitor disruption indicators that matter for cashews:
  • harvest progress anomalies,
  • processing backlogs,
  • port dwell spikes,
  • quality/recall signals (food safety).

Ops outputs

  • Trigger-action playbooks (example thresholds below)

Example triggers (adapt to your baseline):

  • Lead time variance > +20% vs 3-month rolling average on a lane → activate secondary supplier allocation.
  • Two consecutive lots with inbound defects above spec (e.g., moisture/defects) → shift to “tightened inspection + conditional release” and re-balance inventory to protect service.
  • Port dwell time spike or vessel rollover trend → pull forward orders for the next cycle + pause promotions that consume whole grades.

7) Strategic Use Cases Ops Leaders Actually Run (Cashew-Specific)

7.1 Continuity under disruption: protect OTIF and avoid line stoppage

  • Decision: when to reallocate volume and when to authorize spec-flex
  • Artifacts: pre-qualified alternate bench by grade; lane-level lead time ranges; trigger-action plan
  • Metrics: OTIF, line downtime hours, expedite spend, time-to-recover

7.2 Risk-adjusted inventory: reduce working capital without raising stockout risk

  • Decision: dynamic safety stock by supplier/lane/grade (not one blanket target)
  • Artifacts: variability-adjusted reorder points; scenario ranges (best/base/worst)
  • Metrics: inventory turns, service level, emergency buys

7.3 Quality governance that reduces holds and rework

  • Decision: when to place a supplier on conditional status vs exit
  • Artifacts: lane/spec scorecards, CAPA tracking, inbound acceptance trend analysis
  • Metrics: hold rate, claim rate, rework hours, yield loss at plant

7.4 Cost-to-serve optimization: choose the cheapest reliable portfolio

  • Decision: optimize “primary + secondary” awards by expected total cost
  • Artifacts: risk-adjusted landed cost model including variability penalties
  • Metrics: total delivered cost, variability cost, premium freight frequency

8) Why This Matters Beyond Cashew: The Same Intelligence Patterns Apply to Your Other Buys

Cashew is a clean example of a broader procurement truth: multi-node commodities punish feature-only sourcing. Similar dynamics show up in:

  • Cocoa: origin concentration + processing/grinding constraints + logistics shocks; price moves don’t always translate immediately into product availability.
  • Coffee: quality and price depend on origin differentials, milling/export bottlenecks, and shipping reliability—small upstream shocks create downstream service issues.
  • Almonds and walnuts: less processing complexity than cashew, but still exposed to origin concentration, water/climate risk, and grade/spec constraints.
  • Spices (e.g., pepper, vanilla): high sensitivity to origin cycles and quality compliance; supply tightness shows up as allocation and spec pressure.

Transferable ops lesson: build category playbooks around (1) yield/grade drivers, (2) processing bottlenecks, (3) lane variability, (4) quality-gate risk, then tie them to triggers and governance.

9) Why Cashew Is a Powerful Proof Case for Prospective Customers

Cashew forces clarity because it combines:

  • Hard operational constraints (processing throughput, labor intensity, CNSL safety, whole-kernel breakage economics) [4]
  • Non-linear risk (a small outturn shift changes effective kernel supply; a quality event can freeze inventory)
  • Portfolio reality (you need alternates by grade/spec, not just “another supplier”)
  • Measurable outcomes that ops cares about:
  • fewer line stoppages,
  • reduced expedite spend,
  • faster time-to-recover,
  • stable OTIF with controlled working capital.

When an organization can run cashew with disciplined triggers, a real alternate bench, and risk-adjusted inventory, it usually improves how it manages other volatile, multi-node categories as well.

Tridge Eye Data Intelligence Solution

Make Faster, Data-Driven Sourcing Decisions

The insights in this report are just the starting point. Tridge Eye is the data intelligence solution that gives procurement and sourcing leaders real-time market signals, price benchmarks, and supply risk alerts — so you can act before the market moves.

Explore Tridge Eye →

References

  1. hectar.global
  2. styyer.com
  3. cashewconference.com
  4. agriculture.institute
  5. cbsnews.com
  6. vacqpack.com
  7. africancashewalliance.com
Subscribe
By subscribing you agree to with our Privacy Policy and provide consent to receive updates from our company.
Thank you! Your submission has been received!
Oops! Something went wrong while submitting the form.
Subscribe to receive the latest blog posts, updates, promotions, and announcements from Tridge.