Canned skipjack tuna looks “simple” because it ships ambient, but the real procurement levers sit upstream (raw fish access and handling) and midstream (loining yield, canning uptime, packaging readiness, and QA release discipline). This guide maps the physical chain and explains where cost and continuity risks actually lock in—so sourcing leaders can negotiate with the right facts and qualify alternates before allocation or compliance holds force expensive spot buys.
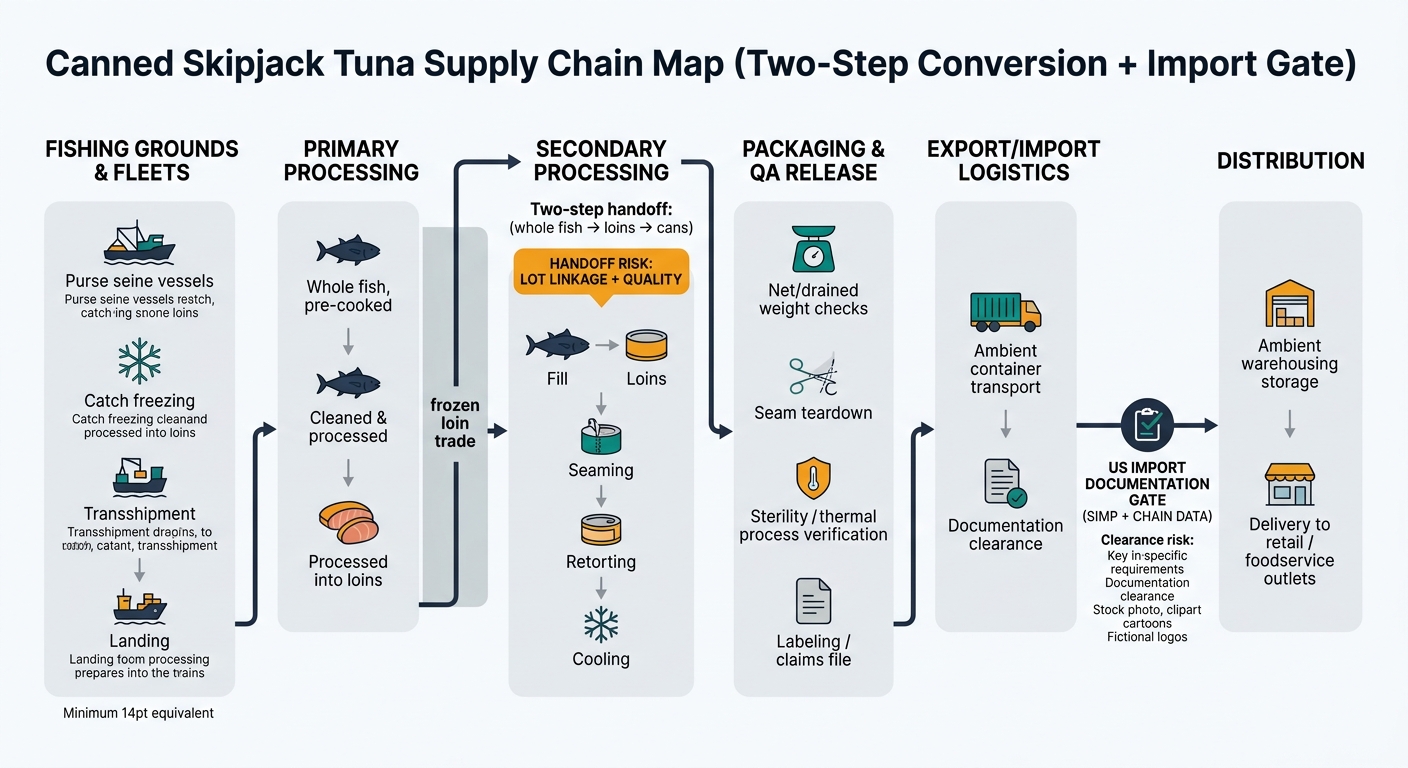
Canned skipjack tuna is a long, industrial chain that starts with tropical purse-seine fishing and ends as a sterile, shelf-stable product shipped ambient in containers. The biggest cost decisions are physically “locked in” upstream (fish availability, access, freezing/handling) and midstream (loining/canning yields, packaging materials, retort energy, QA systems). Downstream, the product is logistically simple (ambient), but service performance depends on port reliability, documentation completeness, and packaging/label accuracy.
Insight: The chain is less about cold-chain distribution and more about upstream catch economics + midstream conversion yield and packaging inputs.
Data: Skipjack is commonly caught in tropical oceans (with the Western & Central Pacific a dominant supply region) and processed through a two-step conversion: whole fish → pre-cooked loins → canned product; each conversion step has yield loss (cook loss + trimming) that magnifies upstream cost shocks. [1]
Procurement Impact: Your landed cost and continuity are structurally driven by (1) raw fish access/availability, (2) loining/canning capacity and yield discipline, and (3) packaging + compliance readiness—more than by finished-goods freight alone.
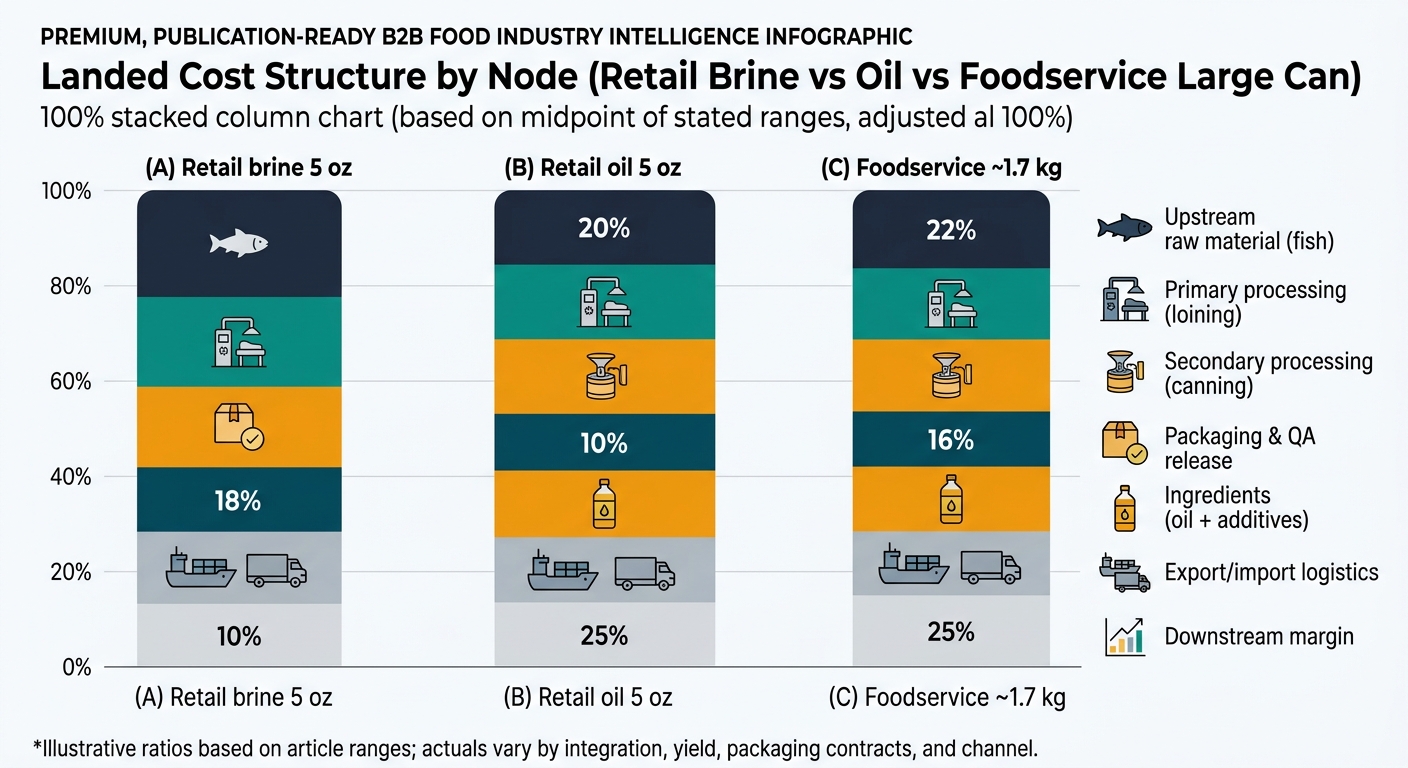
Insight: In canned skipjack, “value-add” margin tends to concentrate where conversion risk is highest: loining yield, canning line uptime, packaging procurement, and compliance release.
Data: The largest variable input is typically raw fish (ex-vessel/frozen whole or loins). The largest non-fish volatility tends to come from metal packaging (tinplate/aluminum ends), edible oils (for oil-packed SKUs), and energy for pre-cook/retort.
Procurement Impact: Understanding node economics helps you interpret why two suppliers with the “same spec” can price differently—one may be structurally advantaged on yield, packaging sourcing, or plant utilization rather than fish cost alone.
| Supply Chain Node | Cost Ratio (% of Final Cost) | Notes |
|---|---|---|
| Upstream raw material (fish) | 40–55% | Dominant driver; depends on whether priced off whole fish or loins and on yield assumptions. |
| Primary processing (loining) | 8–15% | Labor/energy + yield loss; varies by integration and efficiency. |
| Secondary processing (canning) | 10–18% | Line labor, retort energy, downtime, fill control and rework. |
| Packaging & QA release | 12–20% | Cans/ends + cartons/labels; QA systems and release testing add fixed capability costs. |
| Export/import logistics | 5–12% | Ocean freight + port/inland; working capital sensitivity with long lead times. |
| Downstream margin (importer/brand/retail) | 8–20% | Varies widely by channel, service requirements, and promotional intensity. |
| Supply Chain Node | Cost Ratio (% of Final Cost) | Notes |
|---|---|---|
| Upstream raw material (fish) | 35–50% | Fish share can dilute because oil adds material cost. |
| Primary processing (loining) | 8–14% | Similar mechanics as brine; yield still critical. |
| Secondary processing (canning) | 10–18% | Oil handling and fill control increase sensitivity to weight compliance. |
| Packaging & QA release | 12–20% | Metal packaging remains a major non-fish driver. |
| Ingredients (oil + minor additives) | 5–12% | Oil quality/spec (flavor stability) becomes a meaningful cost and quality lever. |
| Export/import logistics | 5–12% | Ambient shipping; same documentation dependencies. |
| Downstream margin (importer/brand/retail) | 8–20% | Channel-dependent. |
| Supply Chain Node | Cost Ratio (% of Final Cost) | Notes |
|---|---|---|
| Upstream raw material (fish) | 45–60% | Larger formats often emphasize protein yield and drained weight performance. |
| Primary processing (loining) | 8–15% | Labor/yield sensitivity remains; texture consistency matters for end-use. |
| Secondary processing (canning) | 8–15% | Economies of scale on line time, but higher consequence of a single lot hold. |
| Packaging & QA release | 8–15% | Packaging ratio can be lower per kg vs retail, but can/end specs are critical. |
| Export/import logistics | 5–12% | Heavy cases influence inland freight; pipeline inventory still material. |
| Downstream margin (distributor/foodservice) | 8–18% | Service-level and contract distribution structure drive variance. |
Insight: Many supply networks are effectively built around loin availability, not just whole fish landings.
Data: Pre-cooked frozen loins are a globally traded intermediate; this enables canneries to decouple fishing geography from canning geography, but introduces an extra yield/QA interface. [2]
Procurement Impact: Traceability, documentation, and quality controls must bridge two manufacturing steps; gaps often appear at the handoff (loin specs, moisture/texture, lot integrity).
Insight: Finished-goods continuity frequently fails at “non-fish” choke points.
Data: Metal packaging supply (cans/ends), artwork governance, and label/claim substantiation are discrete dependencies; a single missing label approval or packaging shortage can idle a plant.
Procurement Impact: Your risk map must include packaging and documentation readiness as first-class constraints, not administrative afterthoughts.
Insight: Canned tuna quality is largely a compliance and process-control problem: weight, seam integrity, sterility, and oxidation management.
Data: Key technical specs that drive cost of poor quality include net/drained weight tolerances, seam teardown metrics, thermal process validation, histamine control upstream (time/temperature control under seafood HACCP), and oxidation/rancidity control in oil-packed SKUs (oil quality + oxygen management + storage). [5]
Procurement Impact: Plants with stronger statistical process control and QA release discipline usually have lower hidden costs (holds, rework, claims), even if their headline conversion cost is higher.
(Analyzed at: Apr, 2026)
Write your contract like the chain actually works: specify the two-step traceability and documentation package (whole fish lot → loin lot → finished can lot) and make it a release gate alongside net/drained weight and seam/sterility controls. This is the most reliable way to prevent the expensive failure mode US importers keep paying for—product that exists, but can’t clear or ship cleanly because SIMP data, label/claim files, or lot linkage is incomplete. [3]
With freight still prone to episodic spikes on Asia–US lanes, the teams that avoid “paper holds” and last-minute relabeling typically protect mid-single-digit total landed cost and, more importantly, avoid the service-level hit that triggers emergency buys at the worst possible time. [4]


