
Canned coconut cream is a dense, shelf-stable emulsion whose cost and risk profile is set less by the can itself and more by (1) mature coconut availability and extraction yield, (2) processing discipline (homogenization + thermal process), and (3) heavy-weight logistics. The physical chain is short, but each node is a quality gate: once fat% and emulsion stability are set at the plant, downstream players can only detect problems—not fix them. Emulsion separation in coconut milk/cream is a known physical defect risk influenced by homogenization and sterilization conditions. [1]
Insight: The supply chain is built around a small number of “conversion points” where raw coconuts become a standardized, sterilized emulsion; most downstream value is packaging, compliance, and distribution rather than transformation.
Data: Typical flow is: smallholder coconuts → aggregation → extraction/standardization → homogenization → retort sterilization in cans + seam formation/inspection → case packing → ambient container export → importer/DC → retail/foodservice/industrial users.
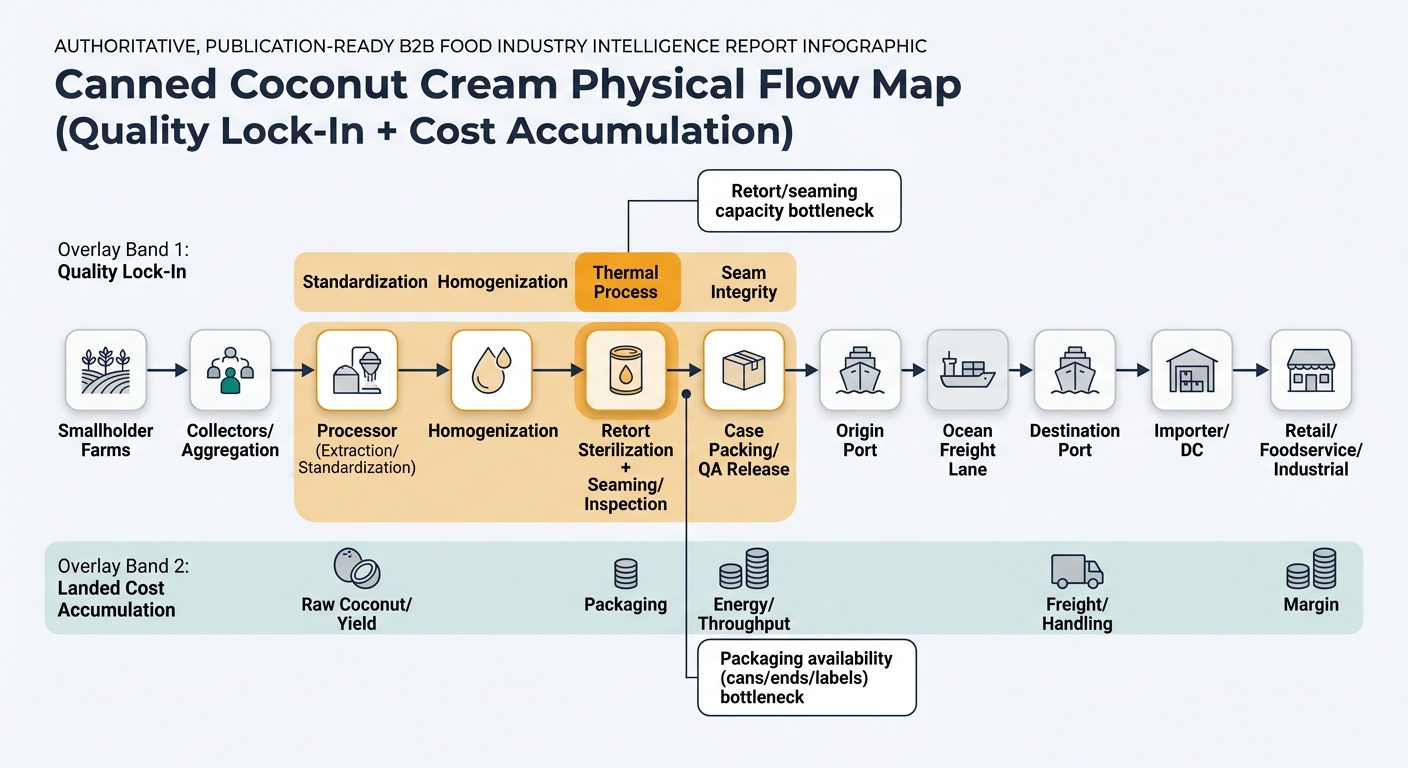
Procurement Impact: Your physical map should treat the processor/retort line as the critical control node (quality + continuity), and treat ocean freight + can supply as the largest non-coconut fixed cost blocks that reliably shape landed cost.
Insight: Costs stack in predictable buckets: raw coconut + yield loss (upstream), energy/water/labor + downtime (processing), can/ends + cartons (packaging), and freight/handling (logistics). Margin tends to be earned at the processor/packer and again at the importer/distributor—because they absorb quality, compliance, and inventory risk.
Data: Canned coconut cream is mostly water + fat; you pay to move weight. Retort processing adds energy and throughput constraints, while packaging metal and ends are often the largest non-ag input.
Procurement Impact: When you compare supply options, you’re effectively choosing a cost structure (yield + energy + packaging + freight) and a failure mode (quality drift vs. logistics delay vs. documentation gaps).
| Supply Chain Node | Cost Ratio (% of Final Cost) | Notes |
|---|---|---|
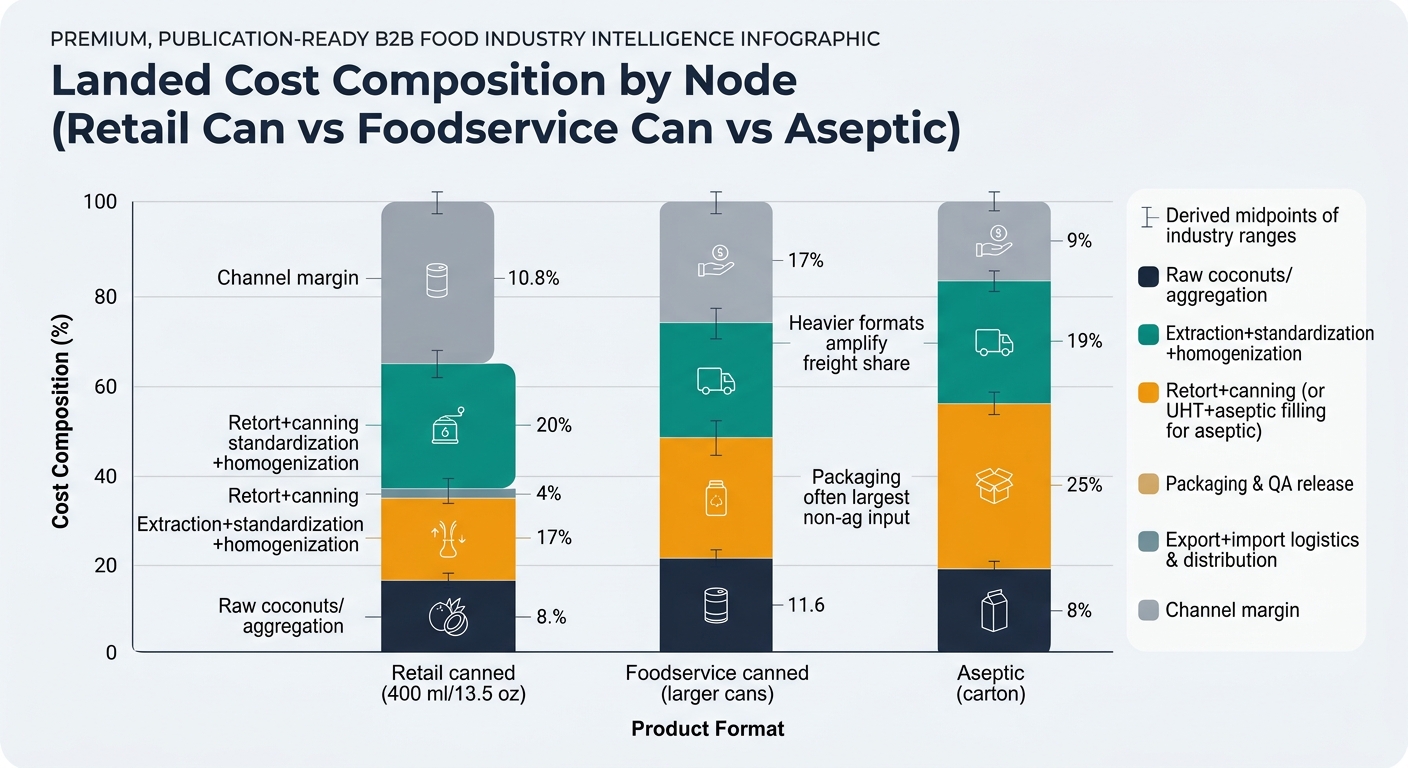
| Upstream raw coconuts + aggregation | 30–45% | Dominated by farmgate nut price + yield variability. |
| Extraction + standardization + homogenization | 10–18% | Water/energy/labor + yield loss + sanitation. |
| Retort + canning operations | 6–12% | Steam/energy + line throughput + verification/records. |
| Packaging & QA release (can/ends/labels/cases) | 12–22% | Cans/ends typically the biggest non-ag input. |
| Export + import logistics & distribution | 12–20% | Heavy product; damage and dwell time add hidden cost. |
| Importer/wholesale/retail margin | 10–18% | Compensation for inventory risk + market access. |
| Supply Chain Node | Cost Ratio (% of Final Cost) | Notes |
|---|---|---|
| Upstream raw coconuts + aggregation | 32–48% | Similar exposure to nut availability and maturity. |
| Extraction + standardization + homogenization | 10–18% | Larger runs can improve efficiency if specs are stable. |
| Retort + canning operations | 6–12% | Throughput and retort scheduling remain constraints. |
| Packaging & QA release | 10–18% | Packaging cost per kg can improve vs small retail units. |
| Export + import logistics & distribution | 12–22% | Weight still drives freight; cases are heavier/denser. |
| Foodservice distribution margin | 8–15% | Depends on channel structure and delivery model. |
| Supply Chain Node | Cost Ratio (% of Final Cost) | Notes |
|---|---|---|
| Upstream raw coconuts + aggregation | 30–45% | Same raw material reality as canned. |
| Extraction + standardization + homogenization | 10–18% | Similar, but formulation/processing may differ by plant. |
| UHT + aseptic filling operations | 8–15% | Higher equipment and validation intensity vs basic canning. |
| Packaging & QA release (aseptic material, caps, cases) | 14–26% | Packaging can be a larger share than cans depending on format. |
| Export + import logistics & distribution | 10–18% | Often lighter per serving; still ambient but damage modes differ. |
| Importer/wholesale margin | 8–16% | Channel-dependent. |
Insight: Canned coconut cream has a few non-obvious constraints that persist across suppliers and years; they shape availability, quality consistency, and the true bottlenecks.
Data: These are physical and industrial-structure facts—independent of short-term market cycles.
Procurement Impact: Treat these as design constraints when setting specs, approvals, and operational expectations.
(Analyzed at: Apr, 2026)
Write your next canned-coconut-cream contract around two auditable anchors: the named manufacturing/retort site (and seaming controls) and the exact packaging specification (can/end/lining + label format), then tie service levels to shipment-level documentation (thermal process records summary + seam inspection evidence + packaging lot trace). FDA guidance is clear that seam integrity failures and retort/cooling stresses can turn into “leakers” and spoilage risk, and in practice these issues show up downstream as disputes, rejections, and emergency rebuys. [5] With freight volatility still a 2026 reality, the teams that win are the ones who can separate “factory constraint” vs “lane disruption” fast—because a single missed container can easily translate into mid-single-digit landed-cost impact once you include expediting, write-offs, and lost service levels. [4]


