INDUSTRY TRENDS

Canned Albacore Tuna Supply Chain: Physical Flow, Cost Lock-In Points, and Procurement Levers

Author
Team Tridge
DATE
April 29, 2026
7 min read
canned-albacore-tuna Cover
Unlock Full Data
Canned Albacore Tuna Market Intelligence
Prices · Trends · Origins · Forecasts

Canned albacore looks like a simple shelf-stable SKU, but it’s a multi-country conversion system where upstream handling, yield, and regulated weight/label rules determine whether you get premium “white” quality—or pay for downgrades, overfill, and import/QA delays. This guide maps the physical chain and the cost nodes so procurement teams can negotiate, qualify alternates, and write contracts that reflect where value and risk actually “lock in.”

Executive Summary

  • Food safety is front-loaded: FDA guidance is explicit that histamine, once formed, can’t be removed by heating—so receiving + time/temperature controls upstream matter more than downstream rework. [1]
  • Yield is the hidden P&L lever: Whole fish → cooked loins → can-fill creates compounded losses; small recovery deltas can swing effective cost-in-use more than a headline $/case change.
  • Pack style is a regulated spec: Codex requires packing medium to be declared and uses standardized drained-weight procedures—so “in water/brine/oil” affects compliance and economics, not just marketing. [2]
  • Thermal process + container integrity are non-negotiable: For U.S.-bound shelf-stable cans, low-acid canned food expectations include scheduled processes and container closure controls—retort capacity and seam checks are real cost/risk nodes. [3]
  • 2026 risk backdrop: South Pacific albacore management and eco-label expectations are tightening (plus broader ESG/forced-labor scrutiny), increasing the value of traceability-ready supplier benches. [4]

1) How the Physical Supply Chain Is Built (and Where Costs “Lock In”)

Canned albacore tuna is a conversion business disguised as a shelf-stable grocery item: most of the final cost is structurally determined upstream by yield loss (whole fish → loins → can-fill), food-safety controls (especially histamine), and fixed plant constraints (precook/retort capacity, labor, and can supply). The physical chain is also split: the tuna may be caught in temperate waters, loined in one country, and canned/packed in another—so quality and compliance must survive multiple handoffs.

Insight: The supply chain is best understood as two “cold-chain” steps (raw fish + loins) feeding one “ambient” step (finished cans), with a hard quality gate at each conversion.

Data: FDA’s seafood HACCP framework treats scombrotoxin (histamine) as a core hazard for tuna; control is fundamentally about time/temperature and receiving controls, and FDA notes histamine cannot be removed once formed. [1]

Procurement Impact: The earliest nodes (harvest handling, frozen storage, loin recovery) determine whether a lot is even usable for “white meat” expectations and whether it will clear import/QA release without rework, downgrades, or holds.

Physical flow (typical):

  • Harvest & onboard handling (longline / troll / pole & line depending on origin and program) →
  • Landing/transshipment + cold storage (freezing discipline drives histamine risk and grade outcomes) →
  • Primary processing (precook + loining) into frozen cooked loins →
  • Secondary processing (canning/packing) fill + seam + retort →
  • Finished goods warehousing (ambient) → export/import → distribution.
A left-to-right supply chain flow showing: Harvest & onboard handling → Landing/transshipment & cold storage → Primary processing (precook + loining into frozen cooked loins) → Secondary processing (fill + seam + retort) → Finished goods warehousing (ambient) → Export/import → Distribution, with labeled cost/quality lock-in gates for time/temperature control (histamine prevention), yield recovery at precook/loining, net/drained-weight compliance and overfill risk at filling, and thermal process plus container integrity (retort/seam checks) before release. Includes simple icons and callouts like downgrade risk, yield loss compounds, overfill to hit drained weight, and hold/rework risk.

2) Where Cost and Margin Accumulate (Node-by-Node)

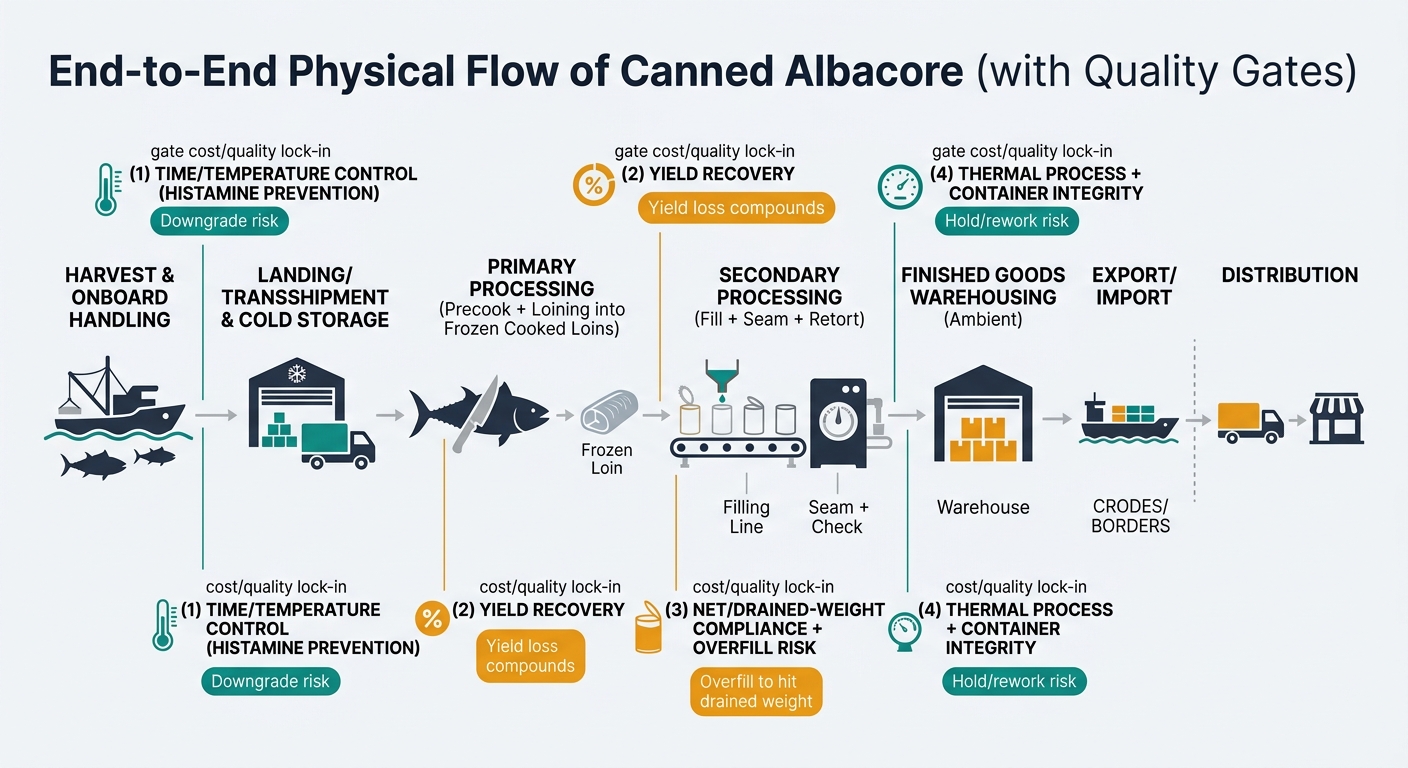
Insight: In canned albacore, “margin” is often a function of conversion yield and capacity utilization more than brand-like pricing power—because each node has measurable loss points (trim, cook loss, drained weight, defects).

Data: Codex provides standardized drained-weight test procedures and links product naming to packing medium—meaning pack style is not a cosmetic choice; it is a regulated spec driver that influences fill weight economics. [2]

Procurement Impact: If you don’t map costs by node, you will misattribute cost changes (e.g., blaming “fish price” when the real driver is yield loss, can/end inputs, or retort downtime).
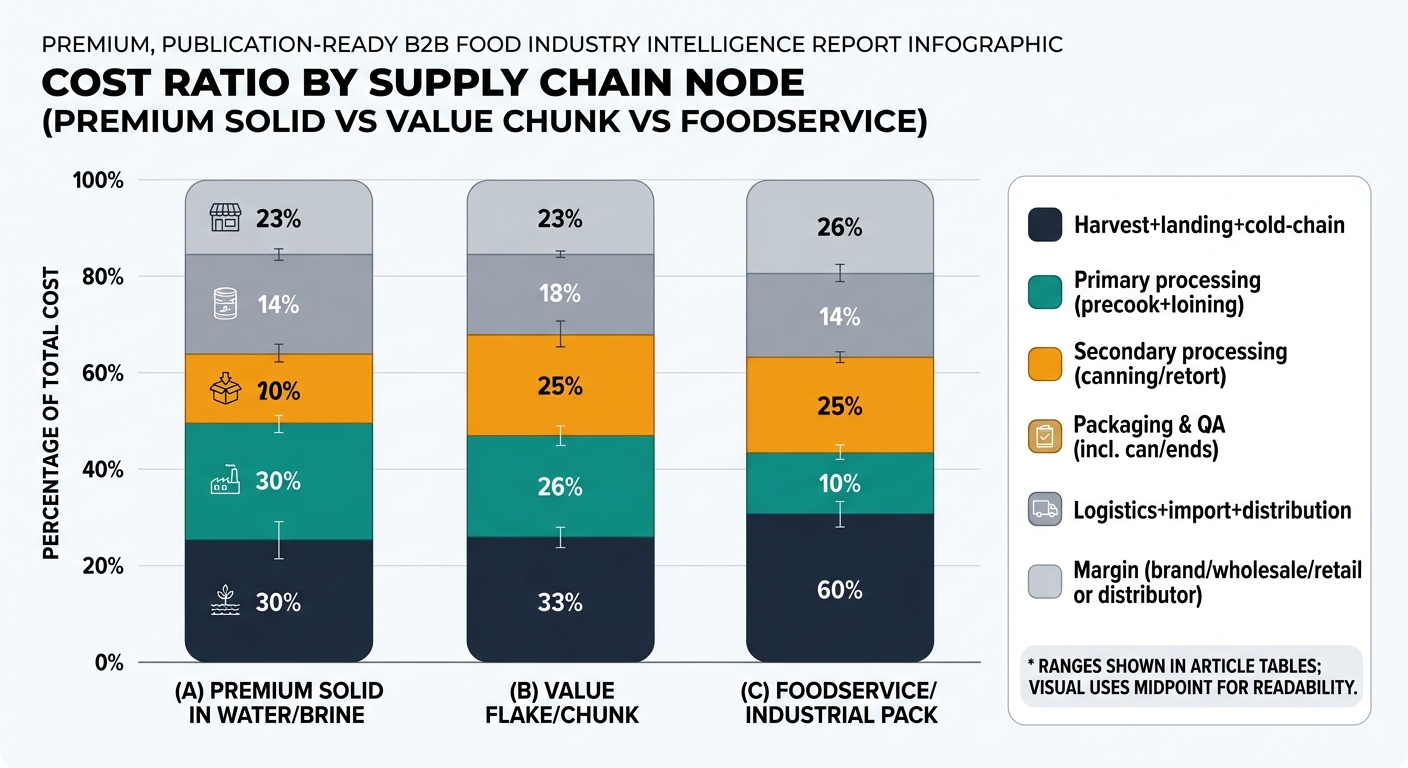
1. Harvest, Landing, and Cold-Chain Stabilization (Whole Fish)

  • Insight: This node sets the non-negotiable floor: fuel/crew economics and time-to-chill determine delivered raw material cost and whether the lot is even eligible for “white tuna” quality.
  • Data: FDA highlights histamine formation risk from time/temperature abuse and states that once histamine forms it cannot be removed by heating; controls rely on rapid chilling and maintaining time/temperature control. [1]
  • Procurement Impact: Programs that require tighter handling (shorter time-to-freeze, stronger documentation, more monitoring) structurally cost more but reduce downgrade/claim risk later.

2. Primary Processing (Precook + Loining into Frozen Cooked Loins)

  • Insight: Primary processing is a yield business: precooking drives moisture/fat loss; loining drives trim loss; both determine how many “can-fill pounds” you get per pound purchased.
  • Data: The mechanism (precook affecting cooking loss) aligns with standard tuna processing reality; verify each supplier’s recovery with your own lot-level data (incoming weight → cooked-loin weight → can-fill/drained-weight performance).
  • Procurement Impact: Two suppliers can quote the same loin price but deliver different effective cost-in-use if their recovery, cleaning standard, and defect sorting differ (dark meat removal, texture, bone fragments).

3. Secondary Processing (Filling, Seaming, and Retorting into Finished Cans)

  • Insight: This is the “capital + packaging” node: retort capacity, seam integrity, and can/end availability govern throughput; small inefficiencies here amplify because the product is already high value after loining.
  • Data: Shelf-stable canned tuna is typically treated as a thermally processed, hermetically sealed product, and U.S. expectations for low-acid canned foods include scheduled processes, process records, and container closure inspection controls. [3]
  • Procurement Impact: Finished-goods cost is highly sensitive to (a) can/end input costs, (b) line uptime, and (c) spec-driven overfill needed to consistently meet drained weight.

4. Packaging, QA Release, and Claims/Traceability Management

  • Insight: QA is not just “testing”—it is a release system: histamine controls, net/drained weight compliance, label/claim substantiation, and lot traceability determine whether inventory is saleable on arrival.
  • Data: Codex defines drained-weight determination procedures for canned tuna products. [2]
  • Procurement Impact: The more claims you carry (species, origin, “in water,” eco-label), the more “paper + process” cost becomes fixed—especially for private label where artwork, approvals, and evidence packages repeat per SKU.

5. Ocean Freight, Import Handling, and Ambient Distribution

  • Insight: Finished canned tuna is ambient and dense (good cube efficiency), but it is documentation-heavy and sensitive to port delays because inventory is often allocated to promotions and service-level commitments.
  • Data: FDA’s seafood HACCP framework emphasizes documented controls and verification across processing and receiving steps in seafood supply chains, including imports. [5]
  • Procurement Impact: Logistics cost is not only freight rate; it is working capital (pipeline time) and disruption exposure (port dwell, exams/holds, relabel/rework if paperwork or claims are wrong).
Sourcing Window Radar
Canned Albacore Tuna — Global Harvest Calendar
ECUADOR SEASON ACTIVE
🇹🇭 Thailand
SEP — OCT
🇪🇨 Ecuador
APR — OCT
🇻🇳 Vietnam
APR — OCT
🇮🇩 Indonesia
SEP — OCT
🇺🇸 United St.
APR — OCT
JanFebMarAprMayJunJulAugSepOctNovDec

Product-Level Cost Breakdown

A stacked bar chart with three bars labeled: (A) Premium Solid in Water/Brine, (B) Value Flake/Chunk, (C) Foodservice/Industrial Pack. Each bar is segmented by: Harvest+landing+cold-chain; Primary processing (precook+loining); Secondary processing (canning/retort); Packaging & QA (incl. can/ends); Logistics+import+distribution; and Margin (brand/wholesale/retail or distributor). Segment sizes use the midpoint of the cost ratio ranges shown in the article tables, with an optional note that ranges are shown in the tables and the visual uses midpoints for readability.

A) Retail Canned Albacore — Solid in Water/Brine (Premium “White” Program)

Supply Chain Node Cost Ratio (% of Final Cost) Notes
Harvest + landing + cold-chain 30–40% Delivered fish cost; handling discipline influences eligibility and downgrade risk.
Primary processing (precook + loining) 15–25% Yield loss + labor intensity; loin recovery is the biggest hidden lever.
Secondary processing (canning/retort) 15–20% Retort capacity + labor + utilities; overfill to hit drained weight adds cost.
Packaging & QA (incl. can/ends) 12–18% Can/ends and labels are structurally significant; QA release and documentation overhead.
Logistics + import + distribution 5–10% Ocean + port + inland; mainly affects working capital and service risk.
Brand/wholesale/retail margin 8–15% Varies by channel and private label vs branded.

B) Retail Canned Albacore — Flake/Chunk Style (Value “White” Program)

Supply Chain Node Cost Ratio (% of Final Cost) Notes
Harvest + landing + cold-chain 28–38% Similar upstream exposure; more tolerance for piece size but not for safety/taint.
Primary processing (precook + loining) 12–20% Slightly more flexibility on piece integrity; still yield-driven.
Secondary processing (canning/retort) 16–22% Higher throughput potential; formulation/medium affects fill economics.
Packaging & QA (incl. can/ends) 14–20% Packaging share can rise if fish input is cheaper or pack formats are complex.
Logistics + import + distribution 6–11% Similar; value programs can be more rate-sensitive due to thinner margins.
Brand/wholesale/retail margin 8–15% Channel-driven.

C) Foodservice/Industrial Pack Albacore (Large Cans)

Supply Chain Node Cost Ratio (% of Final Cost) Notes
Harvest + landing + cold-chain 32–42% Raw material still dominates.
Primary processing (precook + loining) 14–24% Yield remains central; defect sorting may be less cosmetic but still safety-critical.
Secondary processing (canning/retort) 14–18% Larger formats can improve packaging efficiency per pound.
Packaging & QA (incl. can/ends) 8–14% Packaging share often lower per edible pound vs retail multi-SKU programs.
Logistics + import + distribution 6–12% Heavier cases; fewer SKUs but high-volume lanes.
Distributor margin 6–12% Depends on foodservice channel structure.

3) Structural Realities You Can’t “Strategy” Away

Insight: Three structural constraints shape cost and risk regardless of supplier choice: (1) histamine is controlled upstream, (2) yield loss is unavoidable and measurable, and (3) specs are enforced through standardized weights and labeling rules.

Data: FDA states histamine can accumulate if fish are not properly chilled and that once formed it can’t be removed by heating; Codex standardizes drained-weight measurement and requires packing medium declaration. [1] [2]

Procurement Impact: These realities drive recurring “fixed work” for procurement teams—qualification evidence, spec management, and documentation alignment—because failures manifest as holds, downgrades, relabeling, or destroyed inventory.

  • Structural fact #1 (Food safety is front-loaded): Once histamine forms, it cannot be removed by cooking/retorting; the chain must prevent formation through cold-chain discipline and controls. [1]
  • Structural fact #2 (Yield is the hidden cost center): Whole fish → cooked loins → can-fill creates compounded loss (cook loss + trim + sorting), so small differences in recovery rates translate into large unit-cost differences.
  • Structural fact #3 (Pack style is a regulated spec, not a preference): “In water/brine/oil” changes the declared packing medium and interacts with drained-weight compliance, affecting how much fish must be packed to meet label and standard expectations. [2]

Key Insights You Can Apply Immediately (Without Any Buying Strategy)

  • Insight: If you only track “$/case,” you will miss the physics: yield, drained weight, and defect sorting are the true cost levers.
  • Data: Codex drained-weight procedures and FDA HACCP expectations make weight compliance and hazard controls auditable and repeatable—not subjective. [2] [5]
  • Procurement Impact: Build internal alignment on a small set of technical KPIs that mirror the physical chain: loin recovery assumptions, drained-weight targets/tolerances, histamine control evidence, and seam/retort validation documentation.

4) The Bottom Line for Your Next Contract

(Analyzed at: Apr, 2026) In 2026, treat your contract as a risk-and-yield instrument, not just a unit-price agreement: lock in a loin-spec and performance schedule that makes recovery (yield) and drained-weight compliance auditable lot-by-lot, and pair it with explicit upstream time/temperature evidence because FDA is clear that histamine can’t be “fixed” downstream. [1]

With South Pacific albacore management and eco-label expectations tightening—and broader forced-labor scrutiny raising the bar on traceability—the teams that pre-qualify at least one truly independent alternate packer/origin now avoid being price-takers during the next allocation cycle. [4]

Practically, a 1–2 point improvement in effective recovery or a modest reduction in overfill/rework can move total cost-in-use by a few percent—often more than the “win” you’ll get from squeezing another cent per can off the headline quote—while reducing the odds of an import hold turning into a write-off.

Canned Albacore TunaSupply Chain Intelligence
130 countries tracked
10
Exporters
10
Importers
$1.41B
Top Export Value
Top Exporters (2024)
🇪🇨
Ecuador
$1.41B
🇪🇸
Spain
$797M
🇵🇭
Philippines
$416M
🇮🇹
Italy
$313M
🇳🇱
Netherlands
$262M
+125 more
Top Buyers
🇺🇸 United States $1.15B🇮🇹 Italy $971M🇪🇸 Spain $899M🇬🇧 United Kingdom $539M🇯🇵 Japan $384M

References

  1. fda.gov
  2. fao.org
  3. law.cornell.edu
  4. wcpfc.int
  5. fda.gov (Seafood Hazards and Controls Guidance PDF)
Subscribe
By subscribing you agree to with our Privacy Policy and provide consent to receive updates from our company.
Thank you! Your submission has been received!
Oops! Something went wrong while submitting the form.
Subscribe to receive the latest blog posts, updates, promotions, and announcements from Tridge.