
This report is powered by Tridge Eye Data Intelligence.
Every data point, price signal, and supply risk insight in this analysis comes from the same platform that procurement and sourcing leaders worldwide rely on daily. As you read, consider what this level of market intelligence could do for your sourcing decisions.
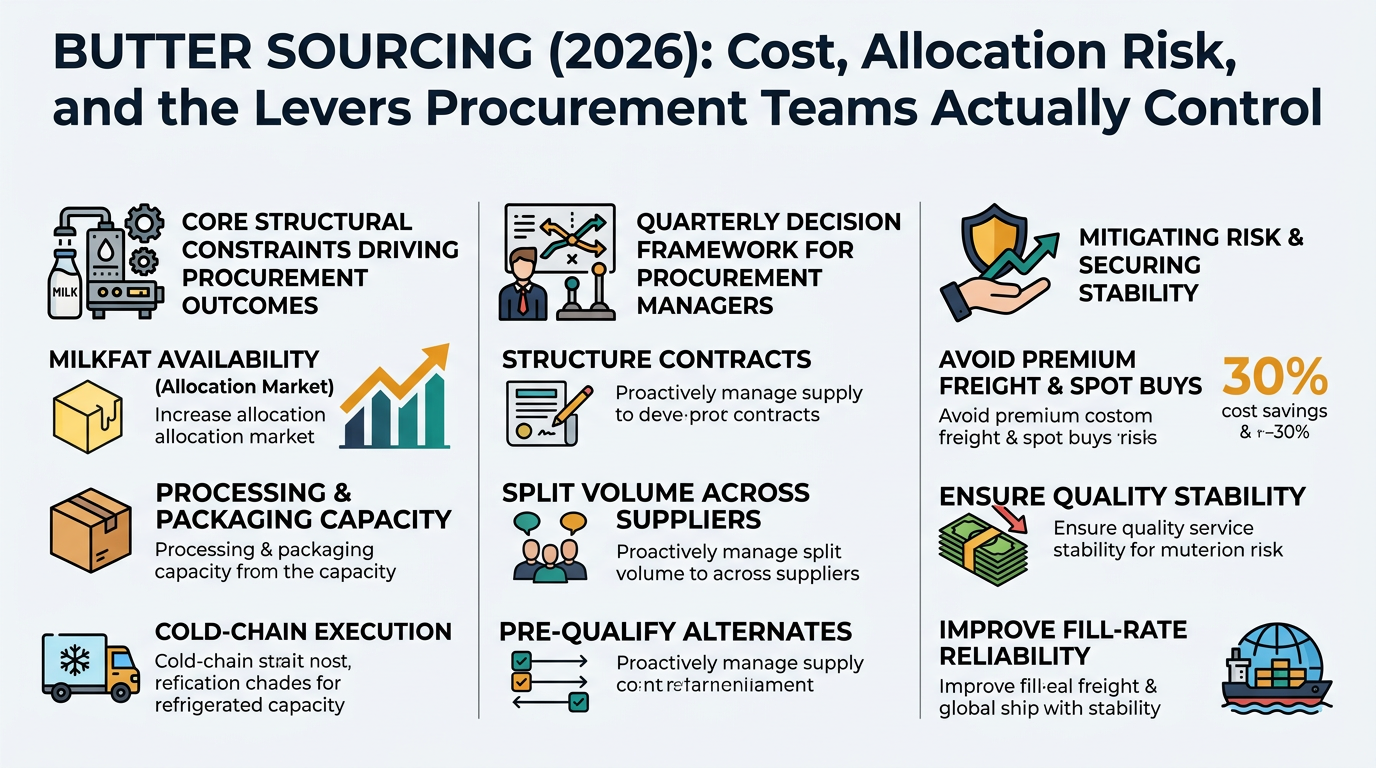
Butter looks like a straightforward commodity, but procurement outcomes (cost, fill-rate, and quality stability) are driven by a tighter set of structural constraints: milkfat availability, processing/packaging capacity, and cold-chain execution. This guide translates those mechanics into the decisions procurement and sourcing managers need to make each quarter—how to structure contracts, how to split volume across suppliers, and how to pre-qualify alternates so you’re not forced into premium freight and spot buys when the market tightens.
(Analyzed at: Mar, 2026)
The savings comes less from “calling the bottom” and more from avoiding the predictable costs of disruption: premium freight, short-ships, rework, and claims.
Butter is not a “simple dairy SKU.” It is a milkfat allocation business wrapped in cold-chain constraints.

Below is the practical procurement takeaway: your realized cost is a function of (a) milkfat economics, (b) processing/packaging capacity, and (c) cold-chain + quality fallout.
Key insight: Butter is a milkfat product—so upstream volatility is driven by milkfat availability, not just milk volume.
Key insight: Butter competes with other uses of cream; when cream is tight, butter input economics change even if raw milk is stable.
Key insight: Churn capacity and the butter-vs-AMF decision create “step changes” in availability.
Key insight: Packaging format is often the real bottleneck—not butter production.
Key insight: Cold-chain is where low price turns into high total cost.
Key insight: Downstream pricing lags can mask market turns.
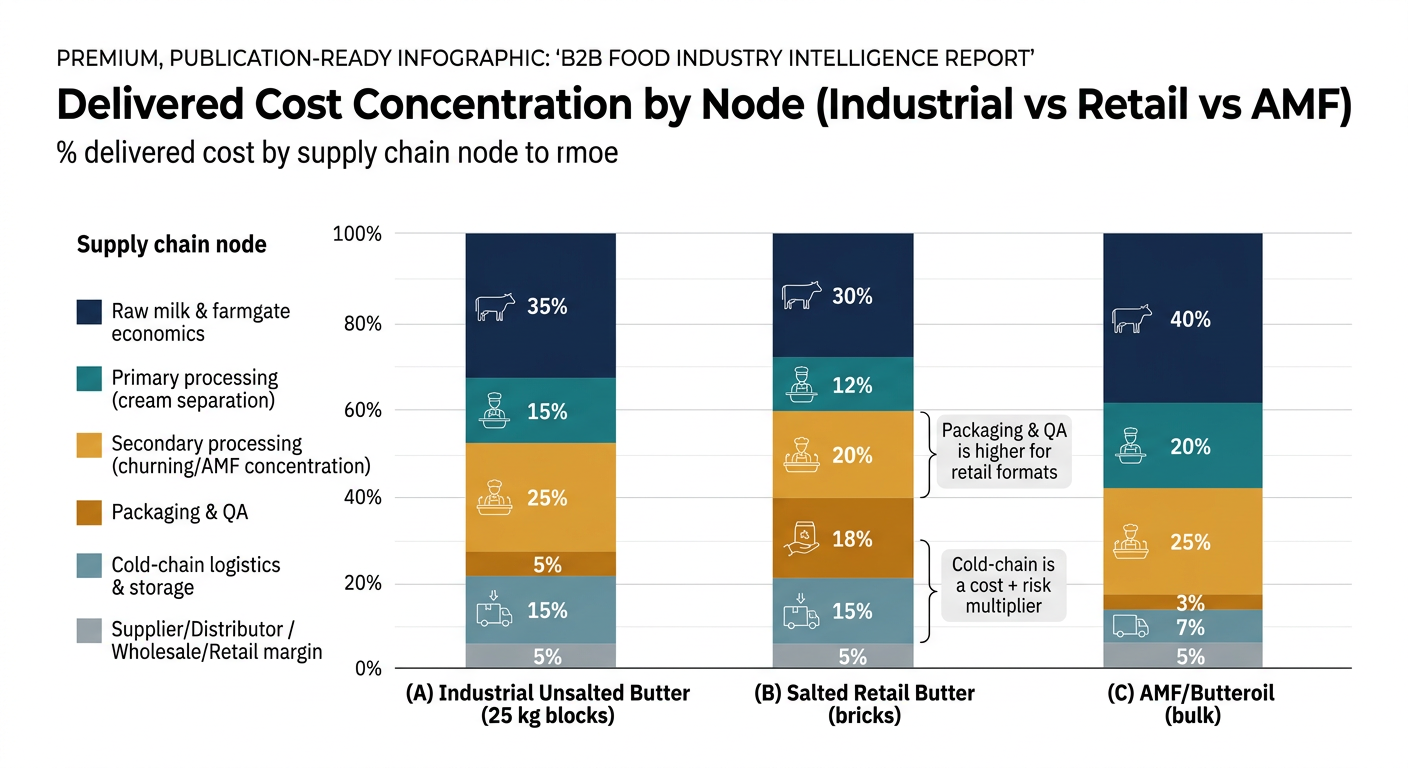
These ratios are illustrative to show where cost concentrates; actuals vary by region, supplier scale, contract terms, and service requirements. They are directionally realistic for procurement planning conversations (where to focus), not accounting statements.
| Supply Chain Node | Cost Ratio (% of delivered cost) | What usually drives variance |
|---|---|---|
| Raw milk & farmgate economics | 45% | Milkfat availability, feed/energy, seasonality |
| Primary processing (cream separation) | 8% | Cream market tightness, plant utilization |
| Secondary processing (churning) | 12% | Energy/labor, churn capacity, downtime |
| Packaging & QA | 6% | Block line capacity, QA requirements |
| Cold-chain logistics & storage | 14% | Reefer rates, distance, storage days |
| Supplier/Distributor margin | 15% | Allocation risk premium, service level |
| Supply Chain Node | Cost Ratio (% of delivered cost) | What usually drives variance |
|---|---|---|
| Raw milk & farmgate economics | 35% | Milkfat economics |
| Primary processing (cream separation) | 7% | Cream allocation |
| Secondary processing (churning) | 10% | Plant efficiency |
| Packaging & QA | 15% | Foil/carton, changeovers, labor |
| Cold-chain logistics & storage | 10% | DC network, shelf-life management |
| Wholesale/Retail margin | 23% | Promo cycles, retailer terms |
| Supply Chain Node | Cost Ratio (% of delivered cost) | What usually drives variance |
|---|---|---|
| Raw milk & farmgate economics | 50% | Milkfat economics |
| Primary processing (cream separation) | 8% | Cream value |
| Secondary processing (AMF concentration) | 15% | Energy, equipment, yield |
| Packaging & QA | 5% | Bulk handling, testing |
| Logistics & storage | 7% | Less cold-chain intensity vs butter |
| Supplier/Distributor margin | 15% | Availability + spec assurance |
If you remember one structural rule, make it this:
This is why you can see:
Recent market commentary has explicitly linked U.S. butter price softness to stronger milk production and increases in milkfat content, leaving more cream available for churns. (Source: Food Business News citing RaboResearch, Sep 2025)
Butter buyers often assume “higher price = more secure supply.” In practice, price and fill-rate can decouple because the tightest constraint may be:
So the procurement problem is not just “what’s the right price?” It’s:
The goal is measurable: lower realized cost volatility without increasing stockout risk.
Decision you face: How much to lock (fixed) vs float (indexed/spot) for the next 90–180 days.
Outcome: fewer emergency buys and more defensible budget performance.
Decision you face: Which alternates to qualify first (you can’t qualify everyone).
Outcome: shorter time-to-switch and reduced premium freight.
Decision you face: How to split volume across suppliers to protect fill.
Outcome: controlled premium for resilience instead of uncontrolled outage cost.
Decision you face: Where to spend SRM time (audits, QBRs, corrective actions).
Outcome: lower hidden costs (claims, rework, customer complaints) and faster resolution.
Butter is a clean example of a broader procurement truth: the biggest risks sit at the intersections (spec × capacity × logistics), not at the invoice line.
Similar patterns show up in categories butter buyers often manage alongside dairy fat:
Intelligence-led sourcing is how procurement teams make these constraints visible early enough to act.
Butter is one of the best “proof categories” because it forces procurement to manage all five realities at once:
When a team can run butter with disciplined signals, portfolio design, and contract governance, they typically can apply the same operating model across the rest of refrigerated and ingredient spend.
Make Faster, Data-Driven Sourcing Decisions
The insights in this report are just the starting point. Tridge Eye is the data intelligence solution that gives procurement and sourcing leaders real-time market signals, price benchmarks, and supply risk alerts — so you can act before the market moves.


