INDUSTRY TRENDS

Bulk Pear Purée Supply Chain Map (for QA/Compliance Purchasing): Flow, Specs, and Where Cost & Risk Lock In

Author
Team Tridge
DATE
September 4, 2026
8 min read
bulk-pear-puree Cover
Unlock Full Data
Bulk Pear Puree Market Intelligence
Prices · Trends · Origins · Forecasts

Bulk pear purée is a deceptively “simple” ingredient: once pears are converted into a stable industrial format (aseptic or frozen), most of your cost, quality risk, and compliance exposure is already locked in by yield, process controls, packaging integrity, and the logistics lane. This guide maps the physical flow, typical spec anchors, and the decision points that matter most for Quality, Safety, and Compliance-focused sourcing.

Executive Summary

  • Two formats, two failure modes: Aseptic shifts risk to sterility + package integrity; frozen shifts risk to cold-chain continuity and thaw/refreeze damage.
  • Spec anchors are real: Single-strength pear purée is commonly around ~10–13° Brix and ~pH 3.9–4.5; concentrates are often ~28–32° Brix (supplier- and program-dependent).
  • Costs “lock in” at three nodes: usable fruit yield, thermal/evaporation energy (if concentrating), and format-driven logistics (dry vs reefer + cold storage).
  • Many “quality” incidents are lane/handling incidents: drum/liner damage, seal integrity failures, and temperature excursions often explain non-conformances that look like supplier quality issues.
A left-to-right supply chain flow showing: Orchard/aggregation → Primary processing (wash/sort/peel/core/mill/finish + pasteurize) → Optional standardization/concentration → Packaging + QA release (branch into Aseptic vs Frozen) → Logistics (dry vs reefer) → Destination storage & industrial use. Overlay three clearly labeled “Cost & Risk Lock-In” callouts at: (1) Usable fruit yield (sorting/trim losses), (2) Thermal/evaporation energy (if concentrating), (3) Format-driven logistics (aseptic ambient vs frozen cold chain). Add small risk icons at key failure modes: browning/oxidation, texture drift/finishing screens, aseptic seal integrity, temperature excursion/drum damage. Keep visuals generic (icons + arrows), no dashboard/UI elements.

1) How Bulk Pear Purée Is Physically Built (and Where Costs “Lock In”)

Insight

Bulk pear purée is a harvest-driven ingredient that becomes “industrial” at the processor: once fruit is sorted/trimmed, thermally treated, and packed (aseptic or frozen), most downstream cost is fixed by yield loss, energy, packaging integrity, and logistics format.

Data

The physical chain typically runs (1) orchard/aggregation of processing-grade pears (often fresh-market diversion) → (2) primary processing (wash/sort/peel/core/mill/finish + pasteurization) → (3) optional concentration/standardization (brix/viscosity/color) → (4) packaging (aseptic bag-in-drum/IBC or frozen blocks/pails) + QA release → (5) inland + ocean freight (dry vs reefer) → (6) destination storage and industrial use (baby food, beverage bases, dairy, bakery fillings).

Procurement Impact

Your biggest “non-negotiable” cost drivers are set at three physical points: fruit usable yield (sorting + peel/core losses), thermal/evaporation energy (especially if concentrated), and format-dependent logistics (aseptic ambient vs frozen cold chain). A clean spec and receiving plan only works if these nodes are stable.

2) Cost & Margin Anatomy by Node (What Each Step Must Pay For)

Insight

Pear purée cost is not a single commodity curve; it is an accumulation of irreversible transformations—each node adds fixed costs (labor, utilities, packaging, compliance) and creates failure modes (browning, texture drift, aseptic integrity, temperature excursions).

Data

Across industrial fruit purées, the processor node commonly carries the highest combination of (a) yield loss and (b) compliance overhead (HACCP, environmental monitoring, lot traceability), while logistics swings materially by format (dry container vs reefer + cold storage).

Procurement Impact

When you compare suppliers or formats, you’re implicitly choosing which node absorbs the most risk: orchard variability (raw material), processor controls (micro/color/texture), or logistics integrity (aseptic seal vs frozen temperature).
1. Upstream / Raw Material (Orchards, Diversion, Aggregation)

  • Insight: The upstream “cost engine” is usable yield, not orchard yield—processing pears often include fresh-market diversion, so defect rates and maturity directly translate into trimming losses and inconsistent brix/pH.
  • Data: Typical physical drivers include (a) maturity/variety (affects sugar/acid balance), (b) bruising/rot incidence (raises sorting rejects), and (c) harvest labor availability (compresses picking windows and increases variability between lots).
  • Procurement Impact: Even with tight finished specs, upstream variability is what creates lot-to-lot COA spread (brix, pH, color). If your application is sensory-critical (infant nutrition, beverage base), upstream controls must be visible via traceability to orchard blocks/regions and clear acceptance criteria for processing-grade fruit.

2. Primary Processing (Wash/Sort → Pulp/Finish → Pasteurize)

  • Insight: Primary processing is where most quality is “manufactured”: finishing (sieve size), deaeration, enzymatic browning control, and pasteurization determine color stability, texture, and micro risk.
  • Data: Key fixed costs include (a) labor for trimming/sorting, (b) water + wastewater treatment, (c) line downtime and sanitation (CIP), and (d) thermal energy for pasteurization. Yield losses occur through peel/core removal and defect sorting; higher defect fruit increases cost per usable kg.
  • Procurement Impact: This node is the root cause of many downstream non-conformances: excess browning (oxidation), seed/skin/foreign matter, and texture drift from finishing changes. If you see recurring holds, it often traces back to inconsistent finishing screens, oxygen control, or sanitation cadence.

3. Secondary Processing (Standardization and Optional Concentration)

  • Insight: Standardization (target brix/viscosity/color) is a blending-and-control exercise; concentration adds an energy-intensive step that amplifies both cost and sensitivity to equipment performance.
  • Data: Concentration via evaporation typically increases utility demand (steam/electricity) and requires tighter fouling control and cleaning; standardization may involve blending lots, adjusting soluble solids, and managing color through controlled exposure and permitted processing aids (supplier-specific).
  • Procurement Impact: If your spec calls for concentrate (or tight brix bands), you are paying for energy and process control—and you inherit more change-control exposure (equipment setpoints, blend rules, processing aids). This is also where authenticity concerns can surface if documentation and mass balance are weak.

4. Packaging + QA Release (Aseptic vs Frozen)

  • Insight: Packaging format is a structural fork: aseptic converts the product into a shelf-stable system where seal integrity is everything; frozen converts it into a cold-chain system where temperature integrity is everything.
  • Data: Aseptic costs are driven by sterile bags, drums/IBCs, aseptic filler validation, and integrity testing; failures are high-severity because rework options are limited. Frozen costs are driven by freezing energy, cold storage, packaging suited for low temperatures, and higher freight intensity (reefer).
  • Procurement Impact: Your receiving risk profile changes by format: aseptic failures show up as swelling/leakers, spoilage, or micro positives; frozen failures show up as thaw/refreeze evidence, texture breakdown, or elevated micro risk post-thaw handling. QA release cycle time must match the format’s failure mode.

5. Logistics & Storage (Inland + Ocean + Destination Handling)

  • Insight: Logistics is not just freight—it's product protection. Pear purée is vulnerable to (a) oxygen/heat-driven color drift (aseptic) and (b) temperature excursions (frozen), plus physical damage to drums/totes.
  • Data: Aseptic typically ships in dry containers with emphasis on drum restraint, puncture prevention, and avoiding extreme heat exposure; frozen requires reefer containers, continuous temperature monitoring, and reliable cold storage at origin and destination.
  • Procurement Impact: Many “quality” incidents are actually logistics incidents (liner punctures, pallet shift, reefer setpoint errors). Your spec is only enforceable if lane qualification, packaging standards, and handling SOPs are aligned to the chosen format.

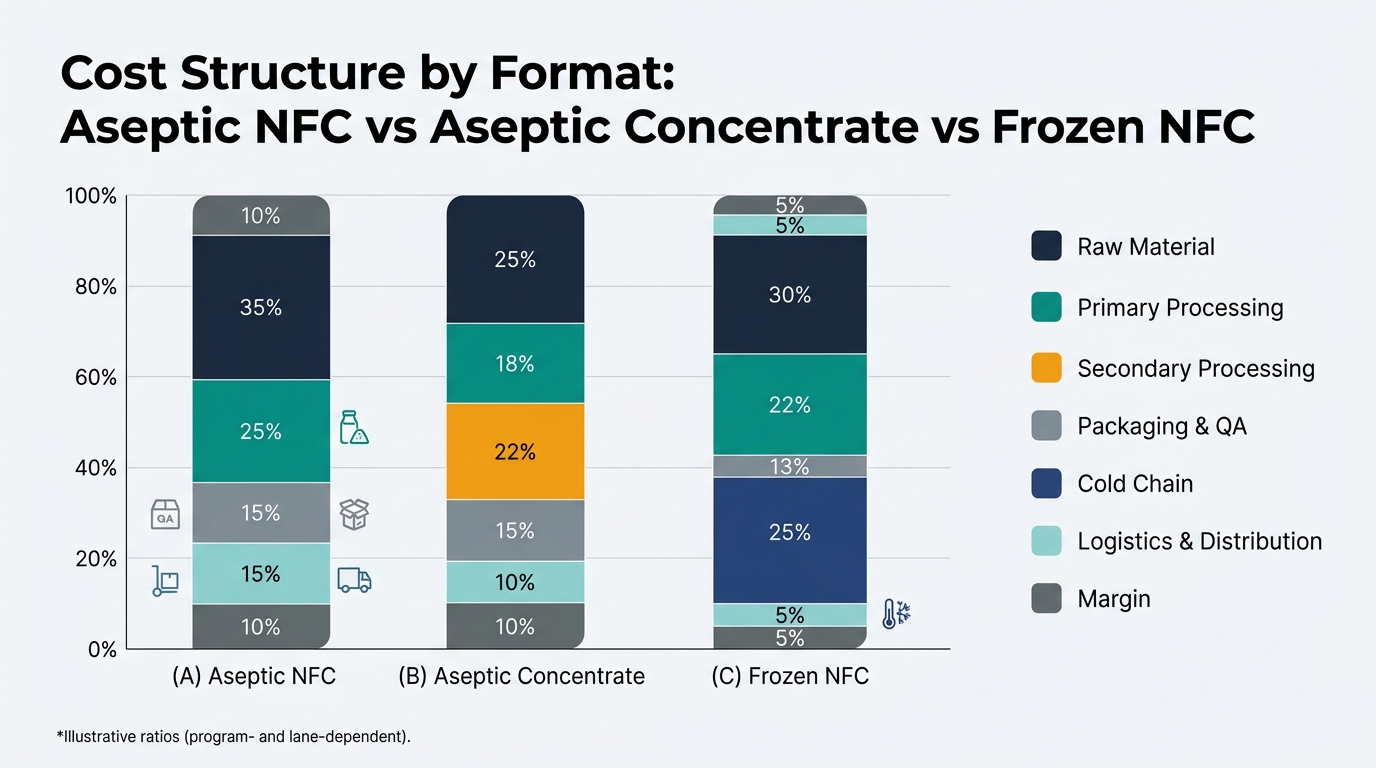
Product-Level Cost Breakdown (Illustrative Ratios)

Three stacked bars (one per format) showing the illustrative cost ratios from the article: (A) NFC Aseptic: Raw Material 35%, Primary Processing 25%, Packaging & QA 15%, Logistics & Distribution 15%, Margin 10%. (B) Concentrate Aseptic: Raw Material 25%, Primary Processing 18%, Secondary Processing 22%, Packaging & QA 15%, Logistics & Distribution 10%, Margin 10%. (C) NFC Frozen: Raw Material 30%, Primary Processing 22%, Packaging & QA 13%, Cold Chain 25%, Logistics & Distribution 5%, Margin 5%. Use consistent colors by node across all bars; include a legend and brief footnote “Illustrative ratios (program- and lane-dependent).” No pricing, no supplier names, no dashboard visuals.

A) Single-Strength Pear Purée (NFC), Aseptic Drum

Supply Chain Node Cost Ratio (% of Final Cost) Notes
Raw Material (pears, aggregation) 35% Usable yield and defect sorting drive effective fruit cost.
Primary Processing 25% Sorting labor, water/wastewater, pasteurization energy, finishing screens.
Packaging & QA (aseptic) 15% Sterile bags, drums/IBCs, aseptic validation, lot testing, release labor.
Logistics & Distribution 15% Inland + ocean dry freight, handling damage risk.
Processor/Distributor Margin 10% Covers overhead, compliance systems, working capital.

B) Pear Purée Concentrate (e.g., ~28–32° Brix), Aseptic Drum

Supply Chain Node Cost Ratio (% of Final Cost) Notes
Raw Material (pears, aggregation) 25% Fruit cost diluted by concentration factor but still yield-sensitive.
Primary Processing 18% Similar steps; tighter control to protect flavor/color pre-evaporation.
Secondary Processing (evaporation/standardization) 22% Steam/electricity, fouling/cleaning, process control and losses.
Packaging & QA (aseptic) 15% Same aseptic integrity requirements; often tighter spec verification.
Logistics & Distribution 10% Lower shipped water reduces freight per solids unit.
Processor/Distributor Margin 10% Higher technical overhead for concentrate operations.

C) Single-Strength Pear Purée (NFC), Frozen (Blocks/Pails)

Supply Chain Node Cost Ratio (% of Final Cost) Notes
Raw Material (pears, aggregation) 30% Same yield drivers; fruit maturity impacts flavor and thawed texture.
Primary Processing 22% Pasteurization may vary by program; sanitation and finishing remain key.
Packaging & QA (frozen) 13% Packaging for freezing, added micro/handling controls.
Cold Chain (freezing + storage + reefer) 25% Electricity, cold storage, reefer premiums, temperature monitoring.
Logistics & Distribution (non-reefer legs) 5% Inland handling still matters; damage can compromise packs.
Processor/Distributor Margin 5% Often offset by higher cold-chain pass-through costs.
Sourcing Window Radar
Bulk Pear Puree — Global Harvest Calendar
CHILE SEASON ACTIVE
🇨🇱 Chile
AUG — NOV
🇲🇽 Mexico
FEB — DEC
🇿🇦 South Afr.
JAN — NOV
🇨🇷 Costa Rica
JAN — NOV
JanFebMarAprMayJunJulAugSepOctNovDec

3) Structural Realities You Can’t “Spec Away”

Insight

Three structural constraints shape pear purée reliability: short harvest windows, processor capacity concentration near growing regions, and format-driven integrity risks.

Data

Pear supply is seasonal (Northern vs Southern Hemisphere), so processors rely on inventory carry (aseptic ambient or frozen) to supply year-round. Processing is capital- and compliance-intensive (aseptic fillers, validated thermal processes, QA labs), which limits the number of truly interchangeable sites. Format choice creates distinct failure modes: aseptic depends on sterility + seal integrity; frozen depends on uninterrupted cold chain.

Procurement Impact

These realities explain why two suppliers with the “same” COA targets can behave differently in practice: different orchard feedstock, different finishing/thermal regimes, and different packaging/logistics controls. Your internal risk register should treat (a) harvest timing, (b) site redundancy, and (c) format integrity as fixed structural variables.

Reality 1: Usable yield is the silent cost driver

  • Insight: Defects and maturity drive trimming/sorting losses more than most buyers expect.
  • Data: Higher rot/bruising increases reject rates and forces more aggressive sorting, raising cost per finished kg and increasing variability.
  • Procurement Impact: Expect more COA spread and higher non-conformance probability when upstream quality is stressed—even if the supplier is technically capable.

Reality 2: Aseptic is “ambient,” not “forgiving”

  • Insight: Aseptic removes cold-chain dependence but replaces it with sterility and packaging integrity dependence.
  • Data: Small integrity failures (pinholes, bad seals, valve contamination) can create high-severity spoilage outcomes.
  • Procurement Impact: Receiving inspection and supplier validation must focus on aseptic system controls, not just end-product micro results.

Reality 3: Frozen shifts cost into infrastructure

  • Insight: Frozen programs buy stability at the cost of infrastructure dependence.
  • Data: Freezing energy, cold storage, and reefer availability become structural constraints.
  • Procurement Impact: Temperature monitoring and lane qualification are as important as the purée spec itself.

Key Insights (What to Remember Before You Read Any Strategy)

  • Fixed cost “lock-in” points: Usable fruit yield, thermal/evaporation energy, and format-driven logistics are the three dominant structural cost anchors.
  • Spec outcomes are manufactured at the processor: Color/oxidation control, finishing (texture), and sanitation/thermal validation explain most supplier-to-supplier performance differences.
  • Format is a risk decision: Aseptic concentrates risk into sterility and package integrity; frozen concentrates risk into cold-chain continuity and storage capacity.
  • Quality incidents often start outside QA: A meaningful share of non-conformances are logistics-handling failures (drum damage, temperature excursions) rather than “bad product” at fill.

4) The Bottom Line for Your Next Contract

(Analyzed at: Sep, 2026) If you buy frozen pear purée, treat reefer capacity and temperature evidence as commercial terms, not “logistics details”: require continuous temperature records (or equivalent lane controls) and define what constitutes an excursion-triggered hold/rejection, because reefer capacity has stayed tight into 2026 and the cost of a single temperature-driven hold is typically measured in expedited freight, scrap, and line disruption—not pennies per pound. If you buy aseptic, make aseptic system validation + package integrity deliverables as explicit as Brix/pH (e.g., integrity testing approach, bag/drum specs, handling SOPs), because small seal failures create high-severity spoilage risk with limited rework options. Either way, the highest ROI move is to contractually align the format’s dominant failure mode with pre-shipment documentation and receiving checks—teams that do this usually avoid the most expensive “good-on-paper” lots that fail in transit or at receiving.

Bulk Pear PureeSupply Chain Intelligence
126 countries tracked
10
Exporters
10
Importers
$21M
Top Export Value
Top Exporters (2024)
🇿🇦
South Africa
$21M
🇪🇸
Spain
$20M
🇮🇹
Italy
$16M
🇬🇷
Greece
$10M
🇩🇪
Germany
$6M
+121 more
Top Buyers
🇺🇸 United States $46M🇩🇪 Germany $15M🇬🇧 United Kingdom $10M🇯🇵 Japan $9M🇳🇱 Netherlands $7M

Related Contents

Subscribe
→
By subscribing you agree to with our Privacy Policy and provide consent to receive updates from our company.
Thank you! Your submission has been received!
Oops! Something went wrong while submitting the form.
Subscribe to receive the latest blog posts, updates, promotions, and announcements from Tridge.