INDUSTRY TRENDS

Black Pepper Sourcing (2026 Guide): Where Cost, Risk, and Specs Actually Move—and How Procurement Leaders Govern Them

Author
Team Tridge
DATE
April 7, 2026
9 min read
Black Pepper Cover
Tridge Eye Data Intelligence Solution

This report is powered by Tridge Eye Data Intelligence.

Every data point, price signal, and supply risk insight in this analysis comes from the same platform that procurement and sourcing leaders worldwide rely on daily. As you read, consider what this level of market intelligence could do for your sourcing decisions.

Explore Tridge Eye →

Black pepper can look like a simple, storable commodity—until you run a sterilized or ground program at scale. Then the “price per kg” becomes the least helpful single number. The outcomes procurement leadership is held to (cost variance, continuity, audit readiness) are driven by a small set of structural realities: origin-linked crop cycles, processing/kill-step capacity, and spec choices that quietly shrink your eligible supplier pool.

Executive Summary

  • Pepper is not one market: Origin and processing pathway (whole vs. ground; sterilized vs. non-sterilized) segment the market and change the supplier universe.
  • Vietnam harvest timing matters: Many Vietnam-producing areas harvest January–April, peaking around February, and industry reporting for 2026 also points to late February through end-April as the main harvest window—this typically increases exporter competition and spot liquidity, but it does not eliminate quality/compliance constraints. [1]
  • Food-safety risk can decouple from price: FDA has reported Salmonella prevalence in imported spice shipments (historically ~6.6% in a 2007–2009 sampling window), and contamination is not visually obvious—meaning risk can spike while pricing looks “fine,” especially for ground/sterilized programs. [2]
  • Spec decisions are a portfolio lever: Tight specs and validated kill-step requirements reduce “switchability” more than most teams expect.
  • Cost-to-serve is form-dependent: Whole pepper economics are raw-material-dominant; sterilized/ground economics increasingly reflect QA hold/release, validation burden, and rework risk.

Key Insights

(Analyzed at: Apr, 2026)

  • Strategy: Hold
  • Reliability: Medium
  • Potential Saving: 4% ~ 10%
  • Insight: Use the 2026 Vietnam harvest window (late Feb–Apr) to re-balance coverage rather than “chase spot”: (1) lock a base layer of whole pepper (or whole sterilized, if required) with clear quality/QA release SLAs, and (2) keep a measured spot tranche only where your specs allow multiple validated facilities. This approach typically reduces emergency buys and demurrage-driven expediting. Rationale: harvest-linked liquidity can improve near-term availability, but sterilized/ground programs remain constrained by validated capacity and QA hold/release realities, so over-exposure to spot can still create line-stop risk. [3]

1) What you’re actually buying: the real black pepper supply chain (ground truth)

Black pepper looks like a simple, storable commodity. In practice, procurement outcomes are shaped by (a) origin concentration, (b) processing choices (cleaning/sterilization/grinding), and (c) compliance risk that behaves differently than price risk.

A left-to-right supply chain flow diagram showing black pepper movement and decision points from farm harvest and drying through primary processing, optional kill step (steam sterilization), secondary processing (cracked/ground) with oxidation and QA scrutiny callouts, packaging and QA release (micro hold-and-release, moisture, foreign matter, residues), ocean logistics (humidity-sensitive with liners/desiccants), and end markets, with procurement decision callouts for origin selection, kill-step requirement, form factor, and spec tightness.

The physical flow (and where procurement decisions “stick”)

  1. Farm-level production (berries → dried black pepper)
  2. Pepper is harvested as green berries; black pepper is produced by drying berries (local practices vary and can include blanching/brief fermentation steps).
  3. Farm drying quality (moisture control, mold prevention, cleanliness) determines downstream yield and rejection risk.
  4. Primary processing at origin / hub
  5. Cleaning (de-stoning, foreign matter removal), grading (often including density-related commercial grade conventions), moisture adjustment.
  6. Optional microbial reduction / “kill step” (commonly steam; other methods exist depending on market/regulatory acceptance and customer requirements).
  7. Secondary processing (cracked/ground; sometimes near end-market)
  8. Grinding increases surface area → higher oxidation/aroma loss risk and typically higher food-safety scrutiny.
  9. Some buyers prefer importing whole (including whole sterilized) and grinding domestically to protect aroma and control QA—at the cost of managing a domestic kill-step/grinding QA regime.
  10. Packaging & QA release
  11. QA is not just “paperwork”: moisture, ash, extraneous matter, microbiology (e.g., Salmonella), residues, and foreign matter controls drive lot acceptance.
  12. Ocean logistics + inland distribution
  13. Pepper is not cold chain, but it is humidity-sensitive (caking, mold risk) and can pick up odors.
  14. End markets
  15. Retail, foodservice, industrial seasoning/blends. Requirements diverge sharply by segment.

Seasonality reality (why timing matters even for a “storable” spice)

  • Many Vietnam-growing regions harvest January–April, often peaking around February (region-specific), and 2026 reporting also frames the main harvest as late February through end-April. [1]
  • Brazil is a major alternate origin; within Brazil, timing varies by producing state and weather patterns—so “Brazil” is not a single seasonal profile.

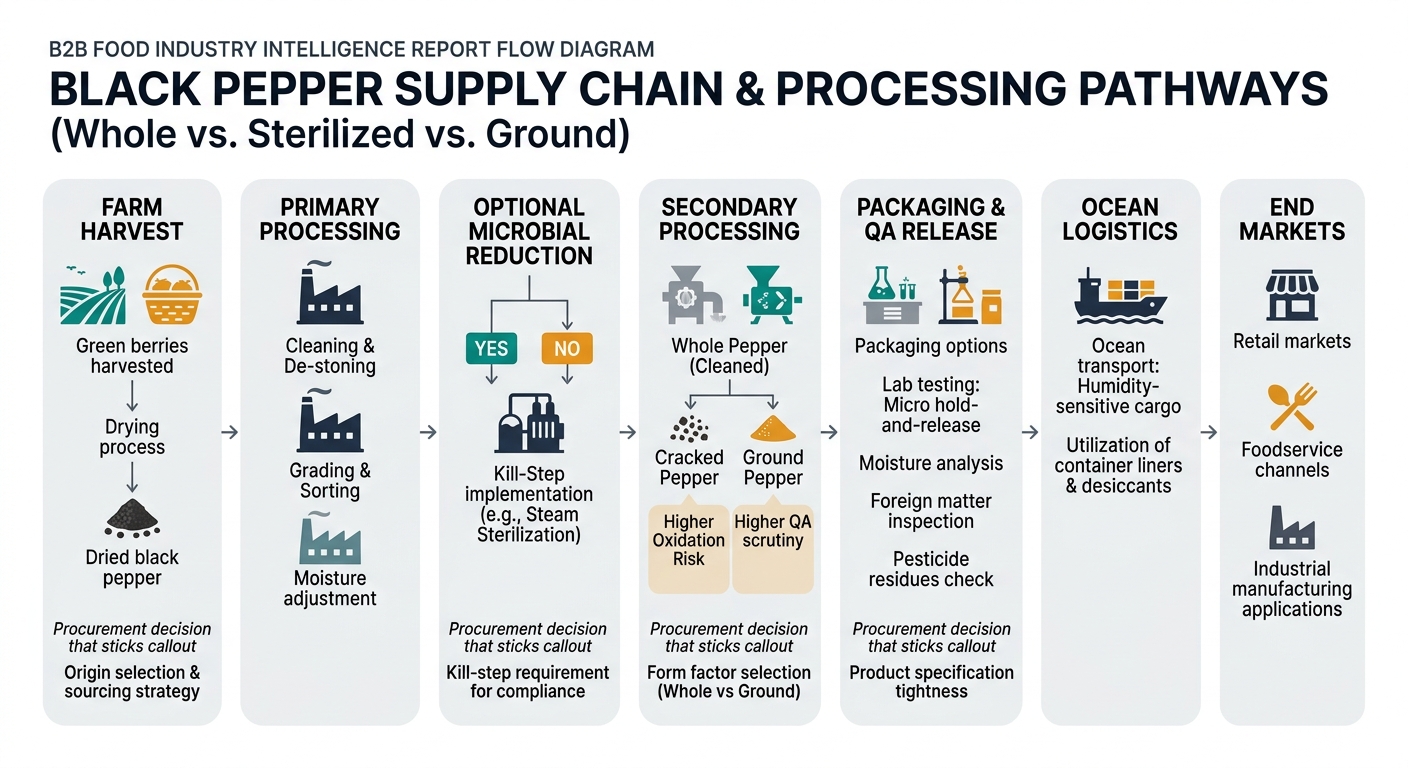
Procurement implication: You’re not only buying “pepper.” You’re buying a specific spec + processing pathway + risk posture that determines your supplier pool and your true switching speed.

2) Where the money accumulates: cost & margin by node (and why forms behave differently)

Key insight: In black pepper, raw material cost dominates whole-pepper economics, but processing + QA + compliance + shrink can dominate the incremental cost of sterilized and ground products—especially when you price in rejection/rework and disruption.

2.1 Upstream / Raw material (farm & local collection)

What’s happening

  • Labor-intensive harvest and drying; quality is “locked in” early.
  • Moisture mismanagement increases mold/microbial load and downstream cleaning losses.

Cost drivers procurement should care about

  • Farmgate price cycle (harvest selling vs holding)
  • Drying losses / downgrades
  • Local financing and inventory carry behavior (tight credit can force selling; easy credit can support holding)

2.2 Primary processing (cleaning, grading, optional sterilization)

What’s happening

  • Export grades often reference cleanliness and physical parameters; commercial trade frequently uses density-related shorthand (e.g., “heavier” grades) even though your internal spec should be defined by measurable acceptance criteria.

Cost drivers

  • Cleaning intensity (stones/metal/foreign matter removal)
  • Grading and blending to hit density/spec
  • Sterilization/kill-step cost + yield impact + validation burden

2.3 Secondary processing (cracked/ground)

What’s happening

  • Grinding increases oxidation risk and can increase the probability of failures if controls are weak.

Cost drivers

  • Milling + sieving + metal detection
  • Higher QA frequency, micro hold-and-release
  • Higher rework exposure (re-sterilize, re-sieve, downgrade)

2.4 Packaging & QA (release to ship)

What’s happening

Moisture limits are common in buyer specs (often around ~12% max for certain ASTA-style specs; some commercial specs allow higher moisture such as ~13.5% depending on the standard/grade). The practical point for procurement: tighter moisture limits reduce mold/caking risk but can reduce supply flexibility and raise cost. [4]

Cost drivers

  • Barrier packaging vs commodity sacks
  • Lab testing (microbiology, residues)
  • Documentation and traceability overhead

2.5 Logistics & distribution (FOB → landed)

What’s happening

  • Humidity protection (liners/desiccants) is commonly used to reduce condensation damage during ocean transit.

Cost drivers

  • Freight + insurance
  • Port delays and demurrage
  • Working capital (inventory sits for months)

2.6 Wholesale/importer + downstream margin

  • Importers/distributors add value via financing, QA release, blending, repacking, and continuity.

Product-level cost breakdown (illustrative ratios)

Modeled percentages to show where cost tends to concentrate by product form. Actual ratios vary by origin, contract terms, sterilization method, QA regime, and market tightness. These are intentionally presented as directional (not claims of an industry “average”).

A) Whole black pepper (FAQ / standard export grade)

A 3-bar stacked chart comparing cost-to-serve ratios for whole black pepper, whole steam-sterilized black pepper, and sterilized ground black pepper, segmented into raw material, primary processing (and sterilization where applicable), secondary processing where applicable, packaging and QA, logistics and distribution, and importer/wholesale margin, with labeled segment percentages and a note that ratios are illustrative and vary by origin, QA regime, and market tightness.
Supply chain node Cost ratio (% of final delivered cost) What moves it most
Raw material + local collection 55% Crop size, farmer selling/holding
Primary processing (clean/grade) 12% Foreign matter burden, density blending
Secondary processing 0% N/A
Packaging & QA 6% Basic testing + sacks/liners
Logistics & distribution 12% Freight + inland + inventory carry
Importer/wholesale margin 15% Financing + continuity + service

B) Whole black pepper (steam-sterilized / validated kill step)

Supply chain node Cost ratio (% of final delivered cost) What moves it most
Raw material + local collection 45% Same as above
Primary processing + sterilization 22% Kill-step cost, yield/shrink, validation
Secondary processing 0% N/A
Packaging & QA 10% Micro hold-and-release, documentation
Logistics & distribution 10% Similar but often tighter handling
Importer/wholesale margin 13% Risk buffering + service

C) Ground black pepper (sterilized, industrial)

Supply chain node Cost ratio (% of final delivered cost) What moves it most
Raw material + local collection 35% Whole-pepper input cost
Primary processing (clean/grade) 10% Input cleanliness affects milling losses
Secondary processing (grind/sieve/metal detect) 18% Throughput, rework, particle spec
Packaging & QA 14% Higher QA frequency, micro controls
Logistics & distribution 10% Similar landed costs
Importer/wholesale margin 13% Liability + service-level risk

3) The structural fact that drives most surprises: “spec decisions” control your supplier universe

Important structural fact: In pepper, spec and form factor (whole vs ground; sterilized vs non-sterilized; moisture limits; cleanliness/foreign matter; particle size for ground) can shrink or expand your eligible supplier pool more than any “supplier search” effort.

What this means in practice

  • Tightening from FAQ to a higher, more consistently controlled physical grade can push you into a smaller set of processors/exporters that can repeatedly hit your acceptance criteria.
  • Requiring a validated kill step (often steam) can move you from “many exporters” to “fewer validated facilities,” increasing concentration risk.
  • Moving from whole to ground often increases:
  • food-safety exposure (more handling, more surface area)
  • QA release time (micro hold)
  • rework probability

Manager-level takeaway: Treat spec as a portfolio design lever, not just a QA preference.

4) The critical insight: why your pepper price and your pepper risk can disconnect

Procurement teams often assume price is the best proxy for risk. In pepper, risk can spike while price looks stable—especially for sterilized/ground programs.

Why the disconnect happens

  1. Microbial risk persists in low-moisture spices
  2. FDA has highlighted spice safety work and sampling related to Salmonella; spices can be contaminated and still look “normal.” FDA has also published historical sampling prevalence figures for Salmonella in imported spice shipments. [2]
  3. A single failure can remove supply capacity overnight
  4. When a facility, brand, or lot fails microbiological expectations, the practical impact is often “approved capacity shrinks,” even if global pepper supply is adequate.
  5. “Approved” is not the same as “available”
  6. Even if multiple suppliers exist on paper, only a subset may match your exact combination of:
  7. certifications
  8. kill-step validation expectations
  9. particle size spec
  10. documentation/traceability

Outcome impact: You can be “on budget” and still be one deviation away from expedited freight, reformulation, or line stoppage.

5) The predictable mistakes procurement teams make in black pepper

These are not buyer-level errors; they’re category-management design errors.

  1. Treating pepper as a single global market instead of origin-linked availability
  2. Result: wrong timing on coverage; overconfidence in spot liquidity.
  3. Over-indexing on density/grade labels without linking to application value
  4. Result: paying for specs that don’t improve your finished product, while shrinking supplier options.
  5. Assuming sterilization is a simple “checkbox”
  6. Result: underestimating lead time, validation constraints, and the cost of rework/holds.
  7. Supplier diversification that’s only “nameplate diversification”
  8. Two suppliers can still share the same upstream collectors, the same sterilizer, or the same export channel.
  9. No measurable “switchability” metric
  10. Many teams track supplier count, but not time-to-switch under a micro, logistics, or documentation event.

6) What an intelligence-driven approach changes (decision-led, not feature-led)

The procurement decision is usually one of these:

  • How much volume do we lock vs leave spot?
  • Do we diversify origins or diversify processors?
  • Do we change form/spec to expand the supplier pool without increasing risk?

How decision intelligence changes the workflow

  1. Start with exposure mapping (what you’re truly dependent on)
  2. % volume by origin
  3. % volume by processor/sterilizer node
  4. lead-time distribution (not just average)
  5. Benchmark offers against the right market reference
  6. Separate:
  7. raw material moves (origin cycle)
  8. processing premium (sterilized/ground)
  9. logistics/financing premium
  10. Build a “ready bench” of alternates aligned to your spec reality
  11. Longlist suppliers by:
  12. origin capability
  13. sterilization availability
  14. documentation posture
  15. Pre-stage what QA and regulatory teams will ask for.
  16. Use triggers, not opinions
  17. Examples of triggers procurement leadership can govern:
  18. price variance vs benchmark beyond X%
  19. OTIF deterioration beyond Y points
  20. rejection rate > Z%
  21. concentration risk threshold (e.g., any single origin > 60%)

What it does not do

  • It does not guarantee the lowest price or uninterrupted supply.
  • It does not replace audits, lab testing, or legal review.

7) Strategic use cases procurement leaders can operationalize in 90 days

Use case A: Reduce volatility without increasing stockout risk

  • Set a coverage policy (example: 60/30/10 contracted/spot/opportunistic) tied to lead-time variability.
  • Measure:
  • price variance vs budget
  • emergency buys as % of volume
  • service-level incidents

Use case B: Build a backup bench for sterilized/ground programs

  • Identify single points of failure:
  • one sterilizer
  • one grinder
  • one documentation pathway
  • Pre-qualify alternates to cut time-to-switch.
  • Measure:
  • time-to-switch (weeks)
  • approved alternates per spec tier

Use case C: Governance and audit readiness for spices

  • Standardize a supplier scorecard with:
  • quality consistency proxies
  • documentation completeness
  • incident history
  • Measure:
  • approval cycle time
  • audit findings related to supplier control

Use case D: Spec strategy to expand supply without raising total risk

  • Run a controlled review with QA/Operations:
  • what specs are truly value-adding vs legacy?
  • what can be relaxed to widen the pool?
  • Measure:
  • eligible supplier count
  • rejection/rework cost trend

8) Why this matters beyond black pepper (adjacent categories you likely manage)

Black pepper is a clean example of a broader procurement pattern: the “spec-to-supply” trade-off.

Where the same logic applies:

  • Cumin, paprika, chili powders: higher adulteration and compliance scrutiny in some markets; “approved supply” can tighten suddenly.
  • Garlic (dehydrated), onion powders: quality variability, moisture/caking risk, and long lead times.
  • Nuts (e.g., almonds, cashews): food-safety and aflatoxin controls can create abrupt supply segmentation.
  • Dried herbs (oregano, basil): microbial controls and cut size specs affect supplier pool and pricing.

Transferable lesson: Procurement advantage increasingly comes from knowing which constraints are structural (spec, validation, origin seasonality) versus negotiable (terms, packaging, incoterms).

9) Why this example is persuasive for procurement leaders evaluating intelligence-led sourcing

Black pepper is a category where leadership can clearly see the ROI of better intelligence because:

  • Small spec differences create large changes in supplier availability and switching speed.
  • Food-safety risk can be material even when the market feels calm, and FDA has documented Salmonella prevalence in imported spices in past sampling. [2]
  • The category has enough liquidity to negotiate—yet enough concentration and compliance sensitivity to punish “lowest-price-wins.”

The management-level outcomes you can govern

  • Cost: reduced variance vs benchmark; fewer emergency buys
  • Continuity: improved OTIF; reduced time-to-switch
  • Risk: lower concentration risk; fewer quality incidents/rejections
  • Governance: audit-ready decision logs; consistent supplier scorecards
Tridge Eye Data Intelligence Solution

Make Faster, Data-Driven Sourcing Decisions

The insights in this report are just the starting point. Tridge Eye is the data intelligence solution that gives procurement and sourcing leaders real-time market signals, price benchmarks, and supply risk alerts — so you can act before the market moves.

Explore Tridge Eye →

References

  1. ipvietnam.gov.vn
  2. fda.gov
  3. en.sggp.org.vn
  4. ieatpe.org.tw
Subscribe
By subscribing you agree to with our Privacy Policy and provide consent to receive updates from our company.
Thank you! Your submission has been received!
Oops! Something went wrong while submitting the form.
Subscribe to receive the latest blog posts, updates, promotions, and announcements from Tridge.