
This report is powered by Tridge Eye Data Intelligence.
Every data point, price signal, and supply risk insight in this analysis comes from the same platform that procurement and sourcing leaders worldwide rely on daily. As you read, consider what this level of market intelligence could do for your sourcing decisions.
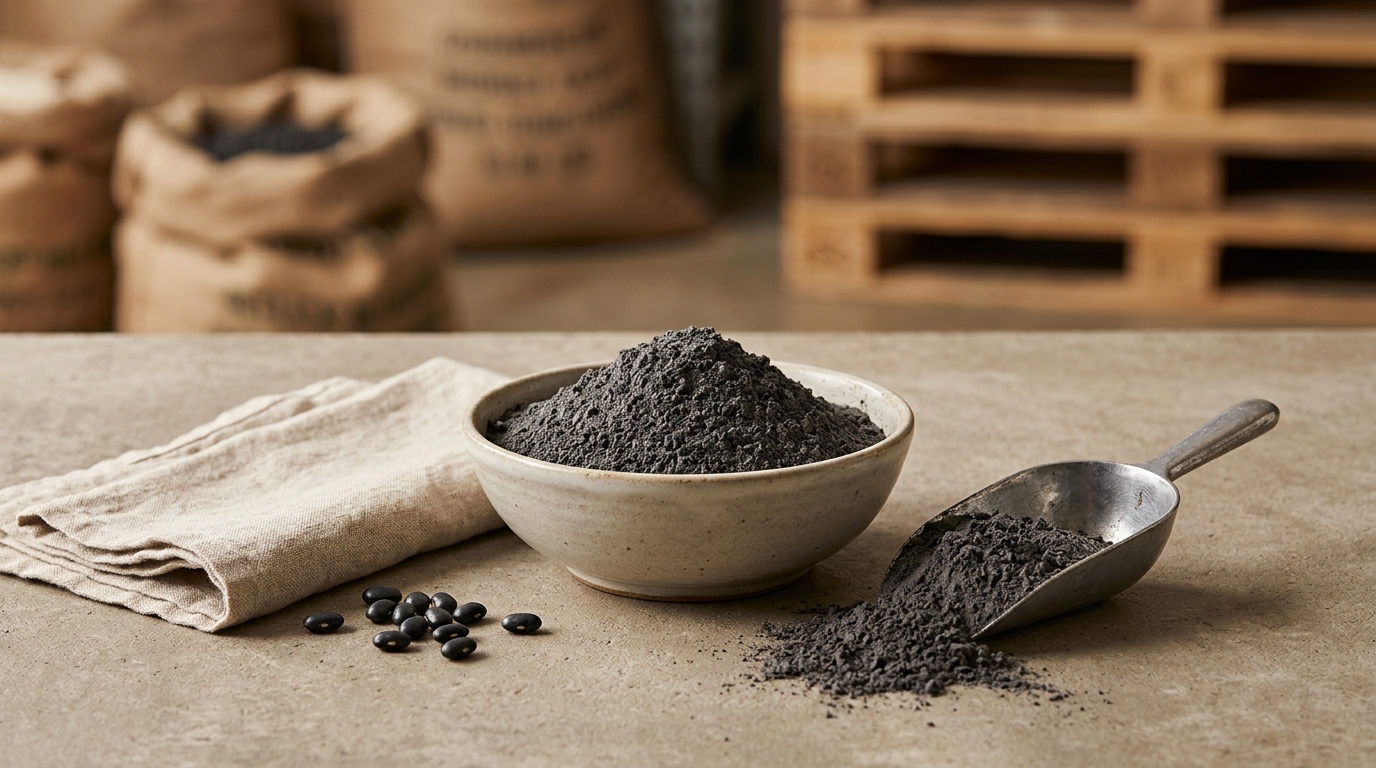
Black bean flour often gets treated like a simple “ambient commodity powder.” In practice, procurement outcomes are usually determined by (1) how much food‑grade eligible bean supply exists in a given season, (2) how much processing is required to hit your spec (color/defects, particle size distribution, micro/claims), and (3) how tight specialized pulse‑milling capacity and logistics lanes are when you need product.
This guide is written for procurement and sourcing leaders who are strong category managers but may be newer to pulse flours. It focuses on the decisions you have to make (spec, contracting, supplier bench, governance cadence), and it separates what you can evidence with market signals and supplier data from what you cannot “guarantee.”
(Analyzed at: Apr, 2026)
Black bean flour looks like a stable, ambient, commodity ingredient—but procurement outcomes are usually driven by (a) food‑grade bean availability and grade premiums, (b) cleaning/dehulling yield losses, (c) milling + optional validated heat-treatment capacity, and (d) QA/compliance overhead that gates eligible supply.

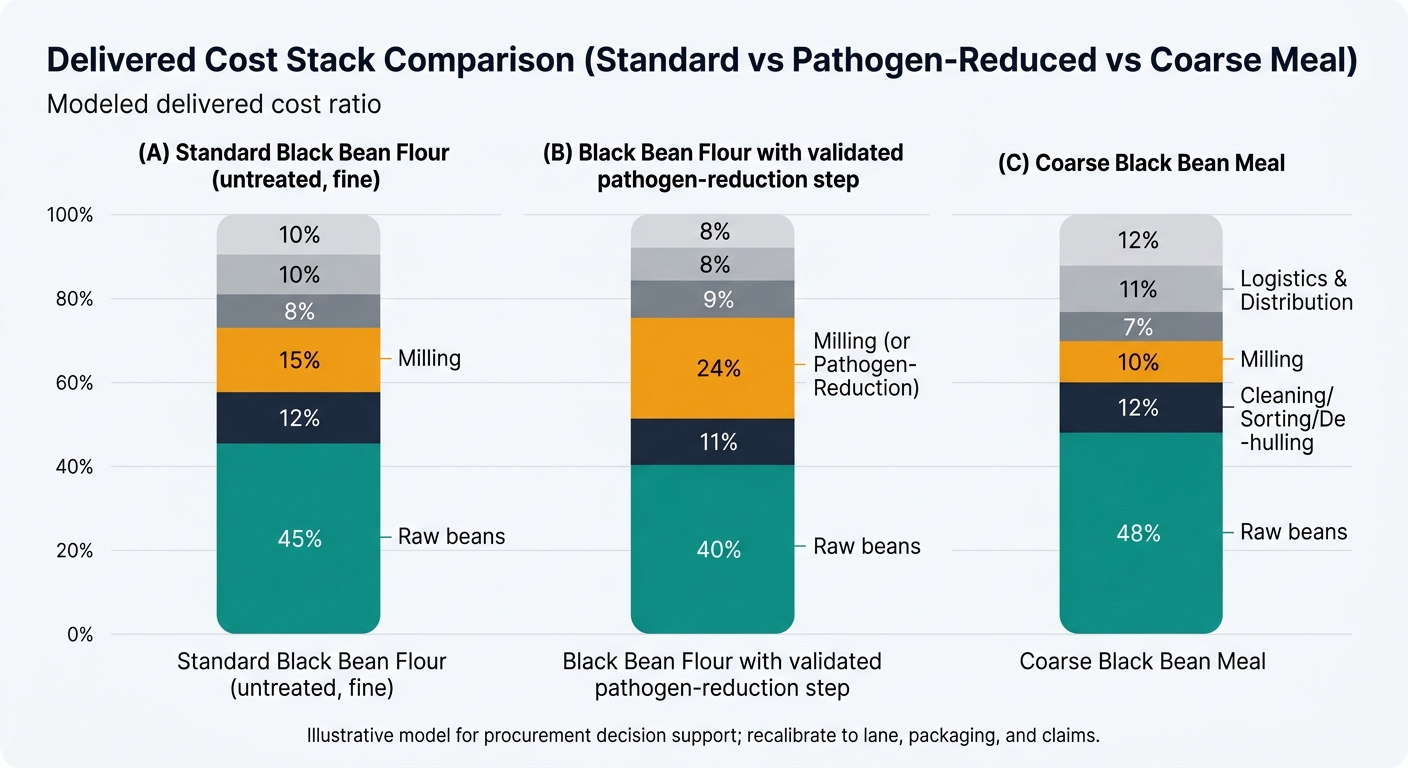
Below is an operational cost build-up. Percentages are illustrative (not a quote) and will vary by origin, certification (organic/non‑GMO), packaging, pathogen-reduction requirements, and service level.
Key insight: In many seasons, the “hidden” cost driver isn’t just the bean price—it’s the premium for food-grade eligible lots (defects, color consistency) and the seasonality of a single annual harvest in major origins.
What drives cost volatility here (procurement-relevant):
Procurement implication: If your supplier’s flour price spikes, it may be because food-grade eligible bean supply tightened, not because milling “suddenly got expensive.”
Key insight: This node is where suppliers “manufacture consistency.” The cost is often justified by:
Commercial reality: Dehulling/polishing can improve appearance consistency for some applications, but it adds steps and shrink—and that shrink gets priced in.
Key insight: Two suppliers can buy similar beans and still quote very different flour prices because milling economics hinge on:
Why PSD is a real cost lever: Pulse flour PSD and functionality vary widely by mill type/configuration; tighter granulation targets typically increase conversion complexity. [4]
Food safety reality (low-moisture): Control programs emphasize sanitation programs, zoning, and environmental monitoring as part of preventive controls; end-product testing alone is not a robust strategy. [1]
Key insight: For black bean flour, QA is not “overhead”—it’s often a gating function that reduces eligible supply.
Cost drivers include:
Key insight: The ingredient is shelf-stable, but it is sensitive to moisture pickup, odors, and infestation in real-world transport and storage.
Risk amplifiers:
Example disruption pattern: The Aug 2024 Canada rail stoppage/lockout risk was widely flagged as disruptive for North American agricultural shipments; even short interruptions can create extended recovery effects. [2]
Key insight: If you buy through distribution, you may be paying for:
Assumptions: industrial buyer, consistent spec, delivered to plant/DC. Actual ratios move with harvest tightness, certification, packaging, and whether a validated pathogen-reduction step is required.
| Supply chain node | Cost ratio (% of delivered cost) | Procurement note |
|---|---|---|
| Raw beans (food-grade) | 45% | Largest driver; moves with harvest grade + carry stocks |
| Cleaning/sorting/dehulling | 12% | Yield loss + segregation + sorting intensity |
| Milling | 15% | PSD spec tightness changes conversion cost |
| Packaging & QA | 8% | CoA, holds, audits, claim documentation |
| Logistics & distribution | 10% | Cross-border and inland freight volatility |
| Supplier/distributor margin | 10% | Service level + inventory buffering |
| Supply chain node | Cost ratio (% of delivered cost) | Procurement note |
|---|---|---|
| Raw beans (food-grade) | 40% | Same exposure, but total denominator increases |
| Cleaning/sorting/dehulling | 11% | Similar, sometimes higher segregation |
| Milling + pathogen-reduction step | 24% | Energy + validation + throughput constraint |
| Packaging & QA | 9% | More documentation; potentially longer holds |
| Logistics & distribution | 8% | Similar, but sometimes more planned shipments |
| Supplier/distributor margin | 8% | Depends on capacity tightness |
| Supply chain node | Cost ratio (% of delivered cost) | Procurement note |
|---|---|---|
| Raw beans (food-grade) | 48% | Still dominant |
| Cleaning/sorting/dehulling | 12% | Similar |
| Milling | 10% | Lower conversion intensity than fine flour |
| Packaging & QA | 7% | Similar testing framework |
| Logistics & distribution | 11% | Same freight reality |
| Supplier/distributor margin | 12% | Often sold into smaller channels |
Procurement teams often benchmark black bean flour as if it were wheat flour—deep liquidity, many mills, broad substitutability.
In practice:
Result: the market can look “well supplied” in beans while your qualified flour supply is tight.
Procurement teams get frustrated when bean prices soften but flour quotes stay firm. The disconnect is usually explainable:
Decision takeaway: You need a should-cost story that decomposes raw beans vs. conversion vs. logistics vs. QA—otherwise negotiations become “my index says down” vs “my costs say up.”
Common failure modes (and how they show up in procurement metrics):
Treating the category as easily substitutable
Under-specifying the product
Relying on end-product testing as the safety strategy
Ignoring logistics as a first-order risk
This is the minimum capability set that typically changes decisions—without dumping “features.”
Use intelligence to separate:
Procurement action: build a should-cost narrative for Finance and for supplier negotiations that explains which lever should move when.
Monitor signals that matter for pulses + milling:
Procurement action: convert signals into a risk register with likelihood/impact and mitigation status.
Identify alternates by:
Procurement action: create a staged qualification roadmap (docs → trial lot → approval).
Standardize:
Procurement action: run QBRs that end with corrective actions and owners.
Assumptions to set up front (so your team isn’t arguing mid-RFP):
Threshold example (typical governance rule):
Output: supplier segmentation (core vs backup).
Trigger examples:
Output: price variance bridge for Finance.
Threshold: if your time-to-qualify is >8–12 weeks (often true when QA/R&D are involved), you cannot treat alternates as an “emergency lever.” Plan it.
Black bean flour is a useful “training case” because it forces procurement to manage spec + safety + seasonality + conversion constraints together. The same intelligence logic applies to:
The transferable procurement lesson: “Ambient powder” does not mean “low risk.”
Black bean flour is small enough to pilot better governance, but complex enough to prove value.
What leadership can measure (without promising outcomes):
Trade-off to surface explicitly:
Make Faster, Data-Driven Sourcing Decisions
The insights in this report are just the starting point. Tridge Eye is the data intelligence solution that gives procurement and sourcing leaders real-time market signals, price benchmarks, and supply risk alerts — so you can act before the market moves.


