INDUSTRY TRENDS

Beef Procurement Intelligence Guide (2026): Turning Cattle-Cycle, Cutout, and Plant-Capacity Signals into Cost, Risk, and Resilience Decisions

Author
Team Tridge
DATE
March 17, 2026
9 min read
Beef (Cattle) Cover
Tridge Eye Data Intelligence Solution

This report is powered by Tridge Eye Data Intelligence.

Every data point, price signal, and supply risk insight in this analysis comes from the same platform that procurement and sourcing leaders worldwide rely on daily. As you read, consider what this level of market intelligence could do for your sourcing decisions.

Explore Tridge Eye →

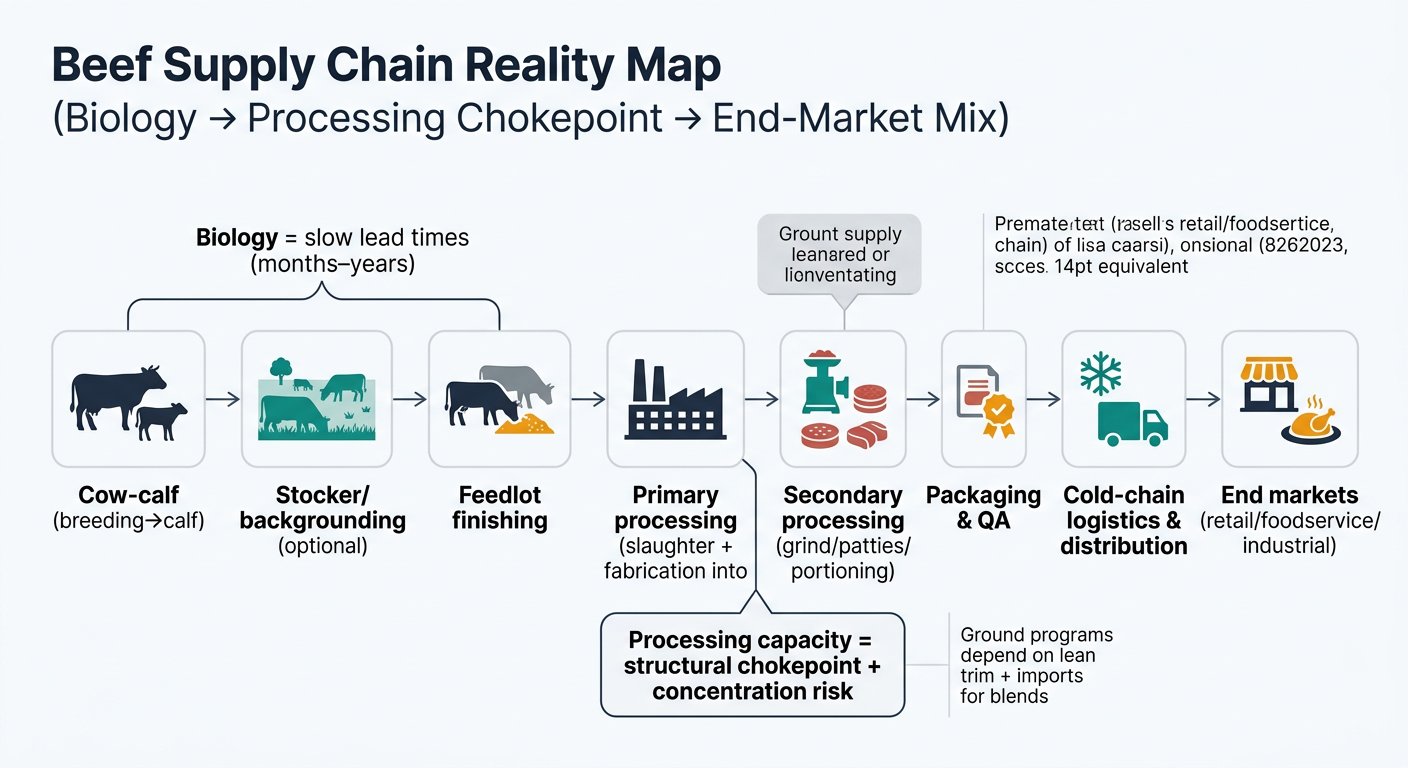
Beef sourcing is one of the fastest ways for procurement leaders to get surprised: upstream supply is slow to change (biology), but downstream pricing and availability can change quickly (processing capacity, carcass balance, and allocation behavior). This guide translates beef supply chain realities into practical procurement decisions—contract structure, supplier/plant portfolio design, spec flexibility, and inventory buffers—so you can control volatility, reduce single points of failure, and improve governance.

Executive Summary

  • Biology creates long lead times: Herd expansion signals today (e.g., heifer retention) typically affect slaughter supply on a multi-quarter to multi-year timeline; you cannot “turn on” cattle supply next month.
  • Processing is a structural chokepoint: The U.S. packing sector is highly concentrated; USDA ERS reports the four largest firms handle ~85% of steer and heifer purchases, which amplifies allocation risk when a major plant is disrupted. [1]
  • Most procurement “price surprises” are spread-driven: Your SKU price is shaped by the cattle-to-boxed-beef spread, carcass balance (primal vs. trim), and (for ground programs) lean-import dependency.
  • Lean imports matter for ground programs: USDA FAS notes U.S. beef imports mostly consist of lean trimmings used for ground beef because domestic trimmings from grain-fed cattle are relatively fatty and require lean product to balance blends. [2]
  • Current (Mar 2026) structural context: USDA NASS reported 86.2 million head of cattle and calves on Jan. 1, 2026 (slightly below Jan. 1, 2025), reinforcing a tight supply backdrop. [3]

Key Insights

Analyzed at: Mar, 2026

  • Strategy: Hold
  • Reliability: Medium
  • Potential Saving: 3% ~ 8%
  • Insight: With U.S. cattle inventories still historically tight (Jan. 1, 2026 inventory ~86.2M head) and the system’s main near-term shock amplifier being processing capacity concentration, avoid over-committing to large fixed-price positions unless you have strong downstream price protection. Instead, shift incremental volume to index-linked or hybrid structures (with collars/reopeners) and invest immediately in plant-level dual-qualification and pre-approved spec flexibility. This typically captures savings via fewer emergency spot buys, better benchmark alignment (correct index to SKU), and reduced allocation premiums rather than “calling the market.” [3]

1) What You’re Really Buying: The Ground Truth of the Beef Supply Chain

Beef procurement decisions behave differently from most food categories because the supply chain is biologically slow upstream and operationally tight midstream.

Reality check (how beef actually flows):

  1. Cow-calf (breeding → calf): biological “factory” that expands/contracts slowly.
  2. Stocker/backgrounding (optional): adds weight on forage; highly weather-dependent.
  3. Feedlot finishing (grain-based in the U.S. for most commodity beef): converts to slaughter-ready cattle; feed costs and placements matter.
  4. Primary processing (slaughter + fabrication into boxed beef): throughput constrained by plant labor/uptime; highly concentrated.
  5. Secondary processing (grind, patties, portioning, value-add): turns trim and cuts into customer-ready formats.
  6. Packaging & QA: spec compliance, food safety, shelf-life and claims segregation.
  7. Cold-chain logistics & distribution: chilled is time-sensitive; frozen adds buffer but changes economics.
  8. End markets (retail, foodservice, industrial): demand shifts change carcass balance and what gets “expensive.”

Why this matters for procurement leaders:

  • You can’t “turn on” more cattle next month—the upstream lead time is measured in many months to years, so short-term shocks transmit into price and allocation fast. [4]
  • Your true supply risk often sits in processing capacity and plant concentration, not on the ranch.
  • Carcass balance means your item’s price can move in ways that don’t track “cattle price” cleanly (e.g., trim vs. steaks).
A left-to-right flow diagram showing the beef value chain with 8 labeled nodes from cow-calf through end markets, with callouts for slow biology-driven lead times across nodes 1–3, processing capacity as a structural chokepoint and concentration risk at node 4, and a note that ground programs depend on lean trim and imports for blends at node 5.

2) Where the Money Really Goes: Cost & Margin Build-Up by Node (and by Product Form)

Key insight: Beef is a co-product system: the carcass is monetized across primals, trim, and byproducts. That means your delivered cost is shaped by:

  • upstream cattle economics (feed, drought, herd cycle),
  • midstream processing constraints (labor, uptime), and
  • downstream mix effects (what retail/foodservice is pulling).

Below is a procurement-oriented view of cost and margin structure by node.

2.1 Upstream: Cow-Calf + Backgrounding + Feedlot (Live Cattle Economics)

What’s happening economically

  • The upstream system is capital- and time-intensive: breeding decisions today influence slaughter supply well into the future.
  • In U.S. grain-fed systems, feedlot finishing commonly runs ~120–160 days; feed and financing costs are meaningful during this period. [5]

Cost drivers procurement should care about (even if you buy boxed beef):

  • Feed (corn/soy/forage) and yardage → drives feeder-to-fed conversion economics.
  • Drought / forage availability → drives cow liquidation vs retention; changes future calf crop.
  • Heifer retention → early signal of herd rebuild (future supply relief) vs continued tightness. [6]

Margin reality:

  • Ranch and feedlot profitability varies widely; upstream is often a price-taker versus packers and downstream demand.

2.2 Primary Processing: Slaughter + Fabrication (Boxed Beef Creation)

What’s happening economically

  • This is the category’s biggest structural choke point: capacity is concentrated and disruptions transmit immediately.
  • USDA ERS notes the four largest firms handle ~85% of steer and heifer purchases—a key driver of allocation risk and bargaining dynamics. [1]

Cost drivers:

  • Labor availability and line speed (throughput).
  • Food safety events / recalls / downtime.
  • Energy + refrigeration + wastewater.
  • Byproduct credits (hide/offal/tallow) that offset packer economics and can change with global demand.

Real-world disruption example (why procurement cares):

  • The JBS ransomware incident (late May–early June 2021) forced shutdowns of JBS beef plants in the U.S., demonstrating how cyber risk can quickly tighten supply and move wholesale pricing. [7]

2.3 Secondary Processing: Ground, Patties, Portioning, Further Processing

What’s happening economically

  • Secondary processors convert trim and lower-value cuts into high-volume formats (especially ground beef and patties).
  • For ground, the critical variable is lean point (e.g., 90CL vs 80/20) and blend strategy.

Cost drivers:

  • Trim market volatility (especially lean trim).
  • Blend optimization (domestic fat trim + imported lean trim).
  • QA risk when substituting sources/specs.

Why imports matter to U.S. ground programs:

  • USDA FAS explains U.S. beef imports mostly consist of lean trimmings used for processing into ground beef, because domestically produced trimmings from grain-fed cattle tend to be higher fat and require lean product to balance to target ratios. [2]

2.4 Packaging & QA: Shelf-Life, Claims, and Segregation Costs

What’s happening economically

  • Packaging choice (vacuum, VSP, MAP) affects shelf-life and shrink.
  • Claims (grass-fed, NHTC, antibiotic-free, halal, etc.) increase segregation, audit burden, and sometimes yield loss.

Cost drivers:

  • Packaging materials and labor.
  • Micro testing, residues, traceability.
  • Rework and downgrades from spec non-compliance.

2.5 Cold-Chain Logistics & Distribution

What’s happening economically

  • Chilled: time-sensitive; service failures show up as shelf-life losses and claims.
  • Frozen: adds resilience but increases storage/working capital and may affect customer acceptance.

Cost drivers:

  • Reefer trucking availability and rates.
  • Cold storage capacity and energy.
  • Inventory carrying costs (especially for frozen buffers).

2.6 End Markets: Retail vs Foodservice Mix (Carcass Balance)

What’s happening economically

  • Demand shocks shift value across the carcass.
  • When steak demand rises, primals can run ahead; when burger demand stays strong, lean trim becomes the constraint.
A stacked bar chart comparing cost and margin build-up across three product forms—fresh/chilled boxed beef, ground/trim programs, and frozen beef—segmented into upstream, primary processing, secondary processing, packaging & QA, cold-chain logistics/storage, and wholesale/distributor margin, using illustrative modeled ranges and noting actuals vary by spec, grade, claims, region, contract, freight, and market tightness.

Product-level cost breakdown (illustrative; % of final delivered cost)

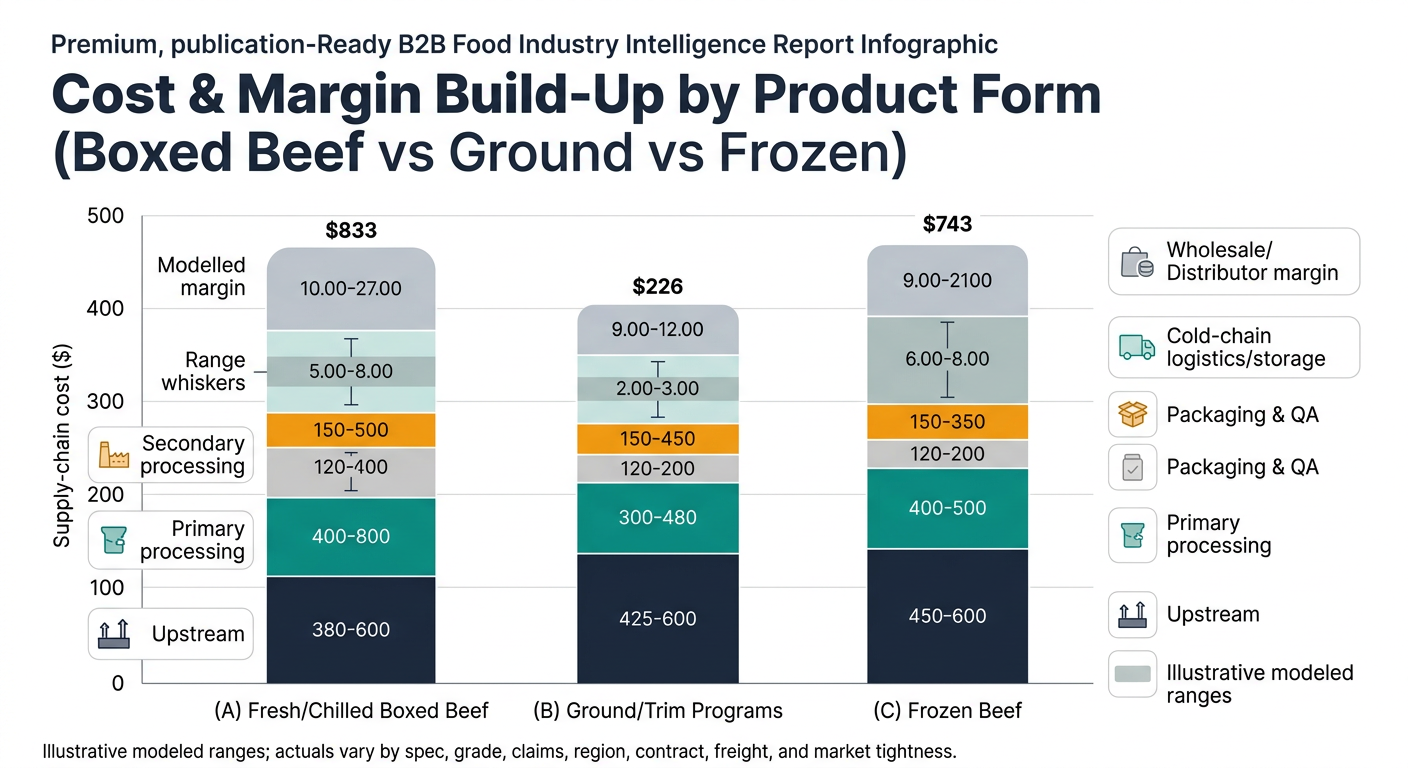
These modeled ranges are meant to show where cost concentrates by product form. Actual ratios vary by grade, program claims, region, contract structure, freight distance, and market tightness.

A) Fresh/Chilled Boxed Beef (Primals/Subprimals)

Supply Chain Node Cost Ratio (% of Final Cost) Notes
Upstream (cattle + feeding economics embedded) 55–70% Live cattle value dominates; shifts with cattle cycle and weights.
Primary processing (slaughter/fab) 8–14% Labor, uptime, yield loss; byproduct credits offset net cost.
Secondary processing 0–6% Often minimal unless portioning/value-add required.
Packaging & QA 3–7% Vacuum bags, labels, testing, program audits.
Cold-chain logistics & distribution 6–12% Distance + service level + reefer constraints.
Wholesale/Distributor margin 5–10% Depends on service model, consolidation, and market tightness.

B) Ground Beef / Trim Programs (e.g., 80/20, 90CL inputs)

Supply Chain Node Cost Ratio (% of Final Cost) Notes
Upstream (cattle + cull cow dynamics) 45–65% Lean trim sensitive to cow slaughter and imports.
Primary processing 6–12% Fabrication and trim generation; constrained by capacity.
Secondary processing (grind/patties) 8–18% Blending, grinding, QA controls, rework.
Packaging & QA 4–10% High QA intensity for ground; labeling and lot control.
Cold-chain logistics & distribution 6–12% Frozen vs fresh materially changes buffer strategy.
Wholesale/Distributor margin 5–10% Higher if value-added patties/portions.

C) Frozen Beef (boxed or value-added)

Supply Chain Node Cost Ratio (% of Final Cost) Notes
Upstream 50–68% Same cattle economics, but timing/hedging differs.
Primary processing 7–13% Similar drivers; inventory can smooth disruptions.
Secondary processing 5–15% More common for frozen formats (patties, IQF).
Packaging & QA 4–9% Cartons/liners, labeling, QA.
Cold storage + logistics 8–18% Storage, energy, longer inventory duration.
Wholesale/Distributor margin 5–10% Depends on service and holding risk.

3) The Structural Fact That Explains Most Procurement Surprises

Structural fact: U.S. cattle supply is tight and slow to rebuild, while processing is concentrated.

  • USDA NASS reported 86.7 million head of cattle and calves as of January 1, 2025 (down ~1% y/y). [8]
  • USDA NASS reported 86.2 million head as of January 1, 2026 (slightly below 2025). [3]
  • USDA’s economic analysis highlights that the largest four firms handle ~85% of steer/heifer purchases, which amplifies allocation risk when any major plant has a disruption. [1]

Procurement implication: Even if your demand is stable, your supply and price risk can jump quickly because the system has limited short-run elasticity and midstream chokepoints.

4) The Critical Insight: Why Your Price Doesn’t Move “With Cattle” (and Why Ground vs Steak Behave Differently)

Procurement teams often assume a simple chain:

cattle price up → my beef price up (same magnitude)

In practice, your price is driven by three interacting “spreads”:

  1. Cattle → Boxed Beef spread (packer margin + capacity):
  2. When slaughter capacity is tight (labor, downtime), boxed beef can rise faster than cattle.
  3. When capacity is ample, cattle can rise while boxed beef lags.
  4. Carcass balance (primal vs trim):
  5. Steak-heavy demand lifts rib/loin.
  6. Burger-heavy demand lifts lean trim.
  7. Your item can move opposite the “headline” beef narrative depending on what part of the carcass you buy.
  8. Lean trim import dependency for ground programs:
  9. The U.S. often relies on lean imported trim to hit target lean points for ground blends. [2]
  10. When domestic cow slaughter falls or import flows shift, 90CL pricing can spike even if other cuts soften.

Procurement takeaway: The right index, contract structure, and supplier strategy depends on whether you’re exposed to:

  • cattle cycle (multi-quarter),
  • processing capacity (sudden),
  • trim/lean-point availability (often fast-moving), or
  • logistics/shelf-life constraints (operational).

5) Where Procurement Teams Typically Get Beef Wrong (Even If They’re Great at Other Categories)

  1. Over-indexing on “annual bids” in a market that reallocates weekly
  2. Beef can shift from normal service to allocation quickly when plants or regions tighten.
  3. Treating suppliers as interchangeable when plants and specs aren’t
  4. A “supplier” may represent specific plants; qualifying the company but not the alternate plant leaves a hidden single point of failure.
  5. Using the wrong benchmark
  6. Comparing prices without normalizing for spec (grade, trim lean point, program claims, pack size, chilled vs frozen) creates false savings narratives.
  7. Not pre-negotiating spec flexibility
  8. Under tight supply, lack of pre-approved substitutions forces expensive spot buys or service failures.
  9. Underestimating ground-beef complexity
  10. Lean-point management and import reliance mean ground programs need different risk controls than steak programs.

6) How an Intelligence-Driven Approach Changes the Outcome (Mapped to Real Procurement Decisions)

This is not about “predicting prices.” It’s about turning signals into earlier, better-controlled decisions.

Decision 1: Contract structure (fixed vs index-linked vs hybrid)

What changes with intelligence:

  • Build a cost-driver narrative around:
  • herd/calf crop direction (multi-quarter),
  • feed and placement signals (quarterly),
  • processing constraints (near-term),
  • trim import dynamics (near-term for ground).

Actionable outputs:

  • Scenario-based negotiation brief (base/upside/downside),
  • Recommended index + guardrails (collars, reopeners, volume bands).

Decision 2: Supplier/plant portfolio design (reduce allocation risk)

What changes with intelligence:

  • Map dependencies by supplier → plant → region → lane.
  • Identify where you are effectively single-sourced due to plant approvals, not vendor count.

Actionable outputs:

  • Plant/supplier portfolio map,
  • Qualification shortlist by spec and geography,
  • Risk heatmap tied to nodes that would actually stop production.

Decision 3: Inventory buffers (fresh vs frozen strategy)

What changes with intelligence:

  • Move from blanket safety stock to risk-targeted buffers:
  • frozen trim buffer for ground programs,
  • limited chilled buffer where shelf-life is the constraint,
  • trigger points tied to early-warning signals (plant downtime, logistics constraints, import disruptions).

Actionable outputs:

  • Trigger-based playbook (when to build, when to draw down),
  • Working-capital vs service trade-off note.

Decision 4: Spec flexibility (pre-approved substitutions)

What changes with intelligence:

  • Pre-negotiate substitutions by cut/form/lean point/pack size/frozen vs fresh.

Actionable outputs:

  • Substitution matrix with QA sign-off workflow,
  • Dual-source plan aligned to spec tiers.

7) Strategic Use Cases Procurement Leaders Actually Run (and What “Good” Looks Like)

  1. Allocation readiness program (boxed beef)
  2. Goal: maintain OTIF during regional/plant disruptions.
  3. Artifacts: plant-level dual-source map, surge clauses, alternate lane approvals.
  4. Ground beef cost volatility control
  5. Goal: reduce exposure to lean-trim spikes.
  6. Artifacts: blend strategy governance, import exposure monitoring, frozen buffer policy.
  7. Supplier QBRs that separate service from market noise
  8. Goal: improve performance accountability without confusing market moves for supplier performance.
  9. Artifacts: scorecards normalized for spec and lane; dispute log; corrective action tracker.
  10. Should-cost and negotiation credibility pack
  11. Goal: align finance/ops on what’s changing (cattle, capacity, logistics) and what’s negotiable.
  12. Artifacts: cost driver narrative, benchmark ranges by spec, contract mechanism recommendations.

8) Why This Matters Beyond Beef: The Transferable Sourcing Lesson

Beef is a clear example of a broader procurement truth: when supply chains are constrained by biology, co-products, and capacity chokepoints, price-only sourcing fails.

Comparable categories procurement teams often manage alongside beef:

  • Pork & poultry: faster biological cycles than beef, but still exposed to disease and processing constraints; mix effects matter.
  • Dairy (cheese/butter): co-product economics (milk components) can create counterintuitive price moves.
  • Coffee/cocoa: long-cycle agriculture + weather shocks; quality and origin segregation drives real cost.
  • Edible oils (soy/palm): policy and logistics shocks; substitution decisions are governance-heavy.

The common pattern: intelligence doesn’t replace negotiation— it improves timing, contract design, and resilience planning.

9) Why This Beef Example Is So Persuasive for Procurement Stakeholders

Beef makes the value of intelligence visible because:

  • The upstream cycle is slow (you can’t fix supply quickly).
  • Processing is concentrated, so disruptions become immediate commercial problems. [1]
  • Carcass balance is real, so “headline market” explanations often don’t match your SKU reality.

What success looks like (metrics procurement leadership can own):

  • Cost control: reduced budget-to-actual variance; fewer emergency spot buys.
  • Supply stability: higher OTIF during tight markets; fewer allocation-driven line changes.
  • Risk mitigation: documented plant-level dual-source coverage; reduced single points of failure.
  • Governance: auditable decision trail (why you chose index vs fixed; why you approved spec flexibility; when triggers were activated).
Tridge Eye Data Intelligence Solution

Make Faster, Data-Driven Sourcing Decisions

The insights in this report are just the starting point. Tridge Eye is the data intelligence solution that gives procurement and sourcing leaders real-time market signals, price benchmarks, and supply risk alerts — so you can act before the market moves.

Explore Tridge Eye →

References

  1. ers.usda.gov
  2. fas.usda.gov
  3. nass.usda.gov
  4. ers.usda.gov
  5. ndsu.edu
  6. ers.usda.gov
  7. axios.com
  8. nass.usda.gov
Subscribe
By subscribing you agree to with our Privacy Policy and provide consent to receive updates from our company.
Thank you! Your submission has been received!
Oops! Something went wrong while submitting the form.
Subscribe to receive the latest blog posts, updates, promotions, and announcements from Tridge.