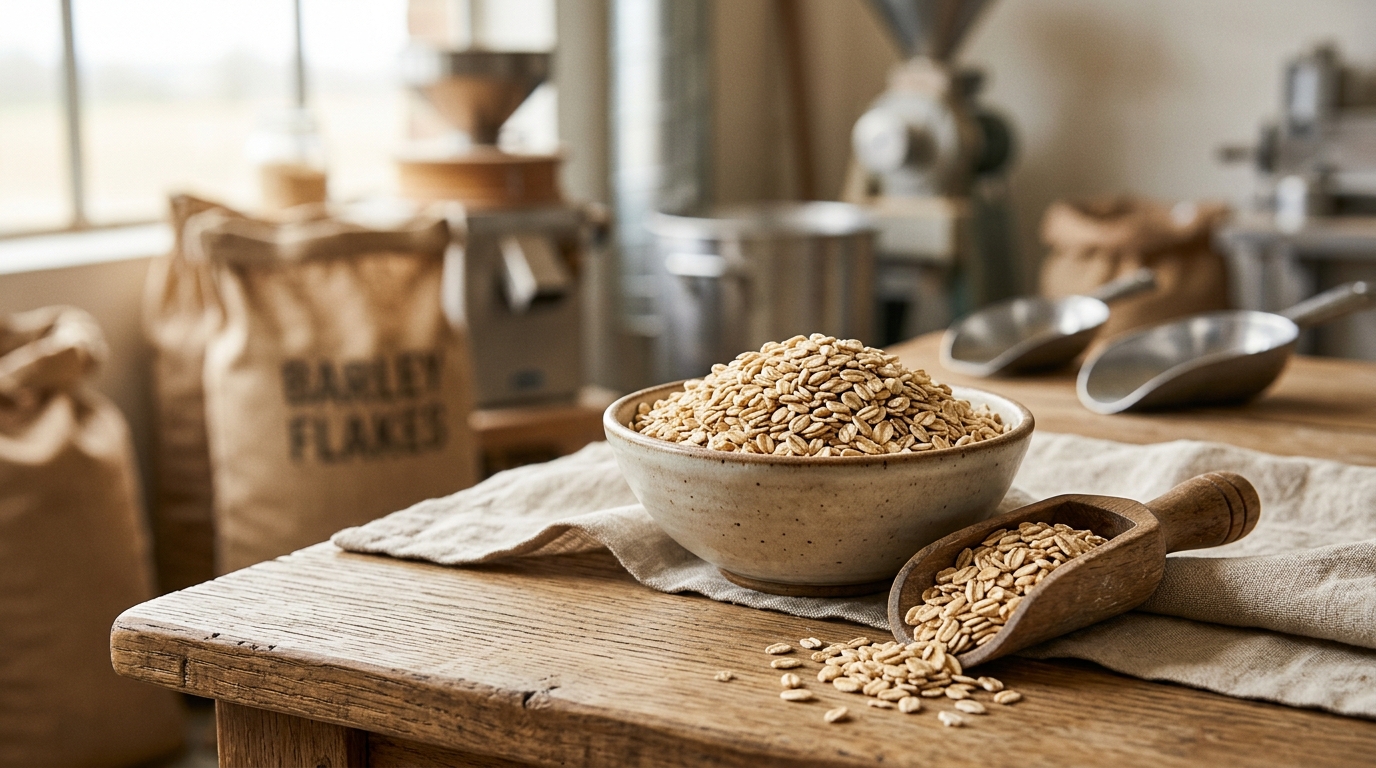
Barley flakes are a processed grain ingredient where the processor—not the farm—typically sets the tightest constraints on availability, consistency, and conversion cost. This guide maps the physical flow, shows where cost “locks in,” and translates technical specs (thickness, moisture, fines) into procurement levers you can use in contracting, supplier governance, and risk planning.
Barley flakes are not a “farm-to-bag” ingredient; they are a grain-to-processor chain where the processor’s unit operations (cleaning, dehulling/pearling, conditioning/steaming, rolling, drying/cooling, screening) determine both usable yield and spec stability. The biggest fixed cost drivers are (1) segregation of food-grade barley lots upstream, (2) yield loss and byproduct economics during dehulling/pearling and screening, and (3) throughput constraints and energy load during conditioning + flaking + drying.
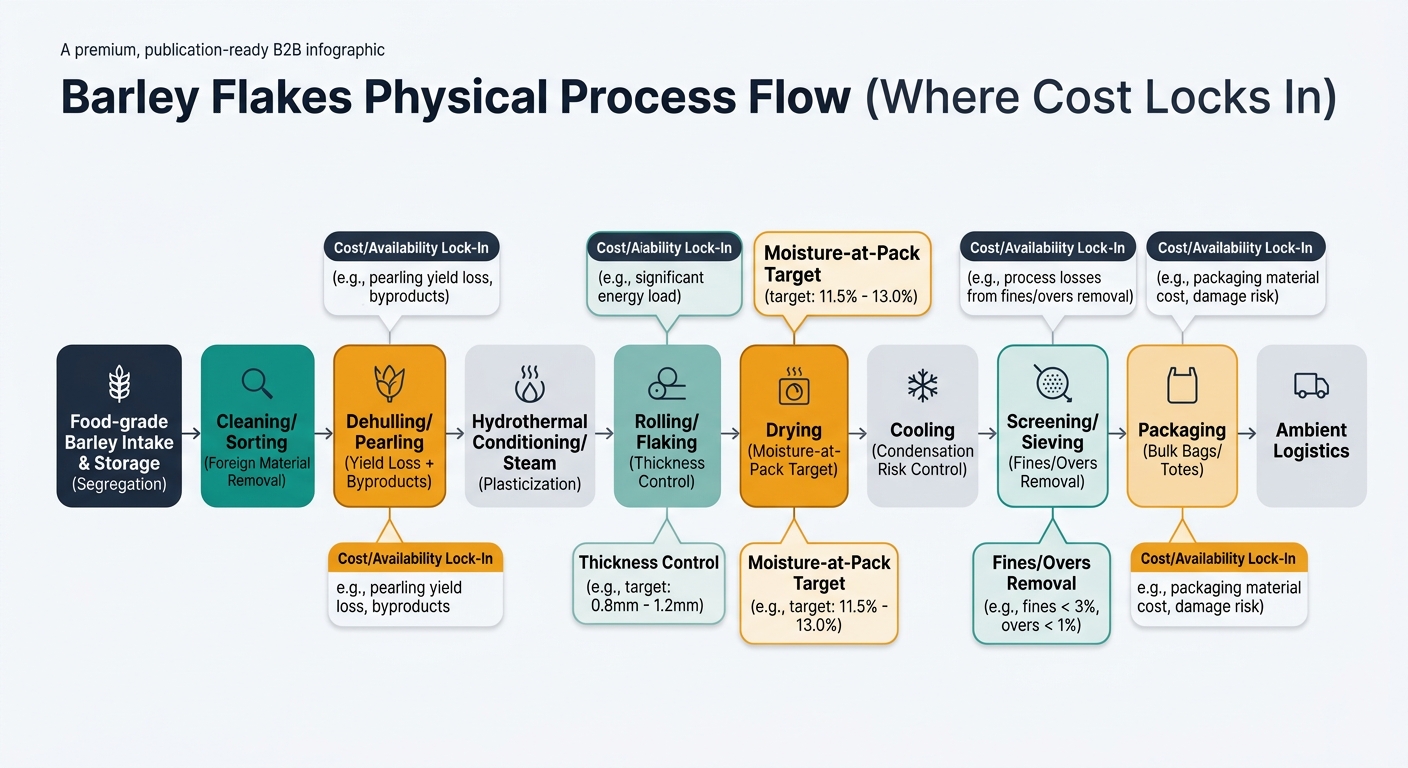
Insight: Barley flakes accumulate cost through yield loss (dehulling/pearling + screening), energy (steam + drying/cooling air), and handling (bulky, low value density).
Data: Peer-reviewed work on barley pearling shows commercial pearling levels sampled in the ~11–34% mass-removal range (with higher removal possible depending on process), illustrating why “same grain in” can yield different “sellable flake out.” [2]
Procurement Impact: The “conversion economics” (how much sellable flake you get per ton of barley input) is a structural driver of delivered cost—independent of market timing.
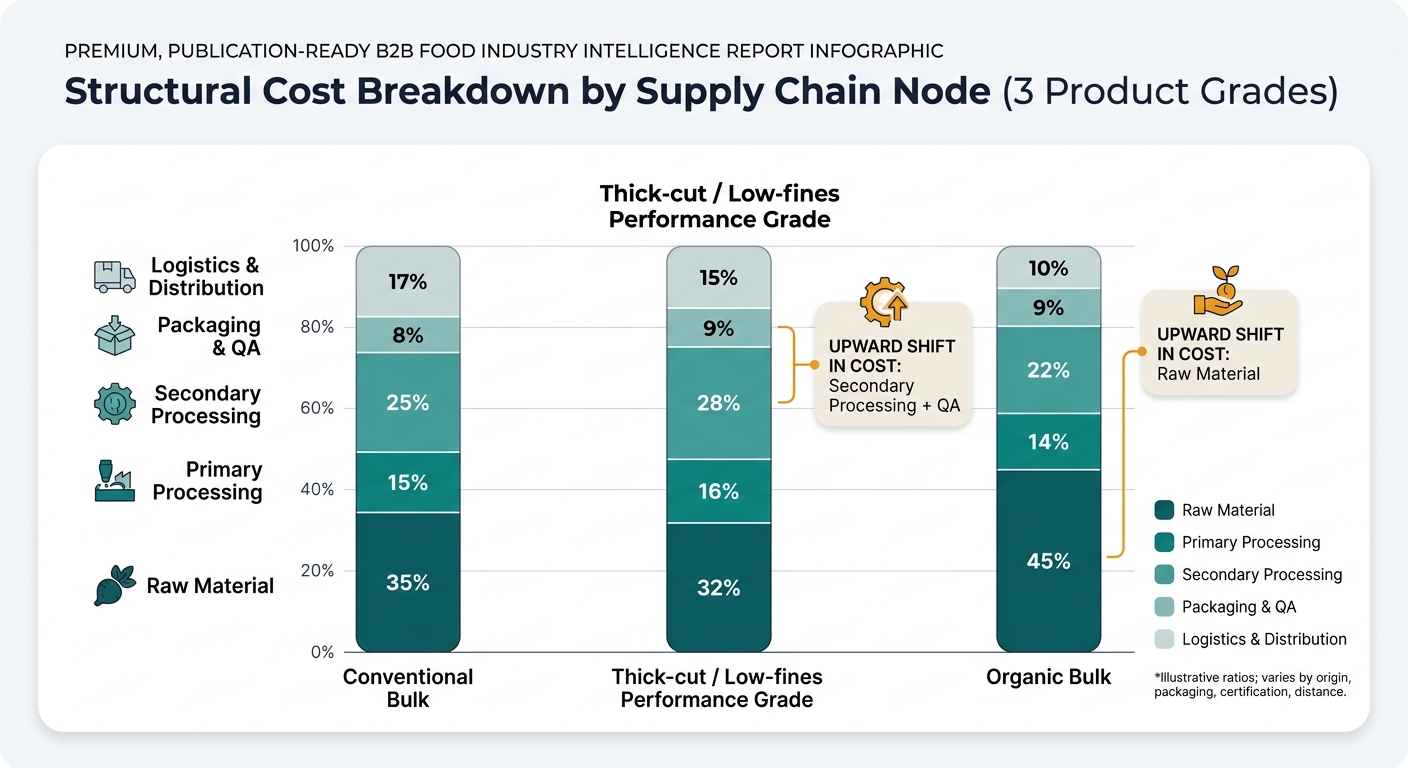
Note: Ratios are indicative for industrial food ingredients; actual splits vary by origin, packaging format, certification, and distance to customer. Use as a structural map of where costs tend to sit.
| Supply Chain Node | Cost Ratio (% of Final Cost) | Notes |
|---|---|---|
| Raw Material (barley + storage/segregation) | 35% | Food-grade premium and storage losses can dominate variability. |
| Primary Processing (clean + dehull/pearl) | 15% | Abrasion yield loss + byproduct credit dynamics. |
| Secondary Processing (condition + flake + dry/cool + screen) | 25% | Energy + OEE + screening losses; core conversion cost. |
| Packaging & QA | 8% | Bulk format minimizes packaging but QA still material. |
| Logistics & Distribution | 17% | Bulky product drives freight/handling share. |
| Supply Chain Node | Cost Ratio (% of Final Cost) | Notes |
|---|---|---|
| Raw Material | 32% | Similar input, but tighter kernel sizing may be required. |
| Primary Processing | 16% | More controlled pearling/cleaning to protect integrity. |
| Secondary Processing | 28% | Lower fines often means tighter roller control + more screening discipline. |
| Packaging & QA | 9% | More testing/inspection to protect claims on integrity. |
| Logistics & Distribution | 15% | Better packaging/handling reduces breakage in transit. |
| Supply Chain Node | Cost Ratio (% of Final Cost) | Notes |
|---|---|---|
| Raw Material | 45% | Organic grain premium + tighter segregation and availability. |
| Primary Processing | 14% | Dedicated/validated cleaning and line controls can add cost. |
| Secondary Processing | 22% | Similar physics; sometimes lower throughput due to changeovers. |
| Packaging & QA | 9% | Certification documentation + additional QA rigor. |
| Logistics & Distribution | 10% | Often shorter lanes if sourced regionally; can also rise if imported. |
Insight: Three structural constraints shape barley flakes availability and cost: conversion yield, processor throughput, and moisture/shelf-stability control.
Data: (1) Commercial pearling levels commonly operate in a measurable mass-removal range (e.g., ~11–34% in commercial levels sampled), so yield is inherently variable by design. [2] (2) Flaking requires steam/hydrothermal conditioning and post-roll drying/cooling and sieving—steps that are energy- and equipment-dependent. [1] (3) Supplier specs commonly publish moisture limits (e.g., “7% max” in some listings), reinforcing that shelf stability is managed, not assumed. [5]
Procurement Impact: These realities explain why two “similar” supply options can behave differently in service levels and complaint rates.
Analyzed at: Jul, 2026
With North American barley supply relatively ample but ongoing volatility in broader production and transport costs, the negotiation “edge” is less about chasing a lower grain-linked number and more about locking conversion performance and service levels. Use a two-part award: secure a base volume with a processor who can evidence line capacity and consistent moisture/thickness control, then place 20–30% with a qualified alternate to keep allocation risk priced in. This works because the flaking line (steam → roll → dry/cool → sieve) is the true bottleneck, and it’s where most avoidable losses and complaints originate. In practice, tightening COA-backed thickness/moisture/fines controls and enforcing change-control is often worth a low-to-mid single-digit landed-cost swing through fewer holds, fewer claims, and less “hidden yield loss,” even if the invoice price barely moves. [3]